

Question: Burn chart 1 burn chart 2 burn chart 3 Compare the charts provided. Be sure to cover the planned/committed velocity for the timeblock, the actual
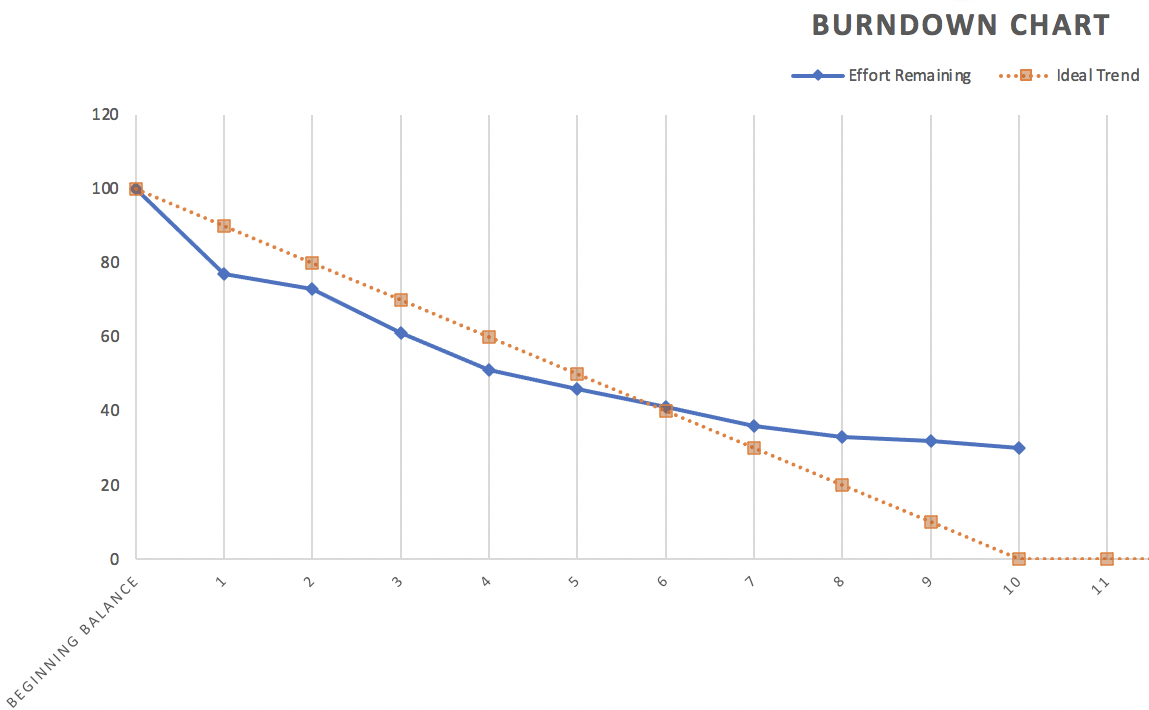 Burn chart 1
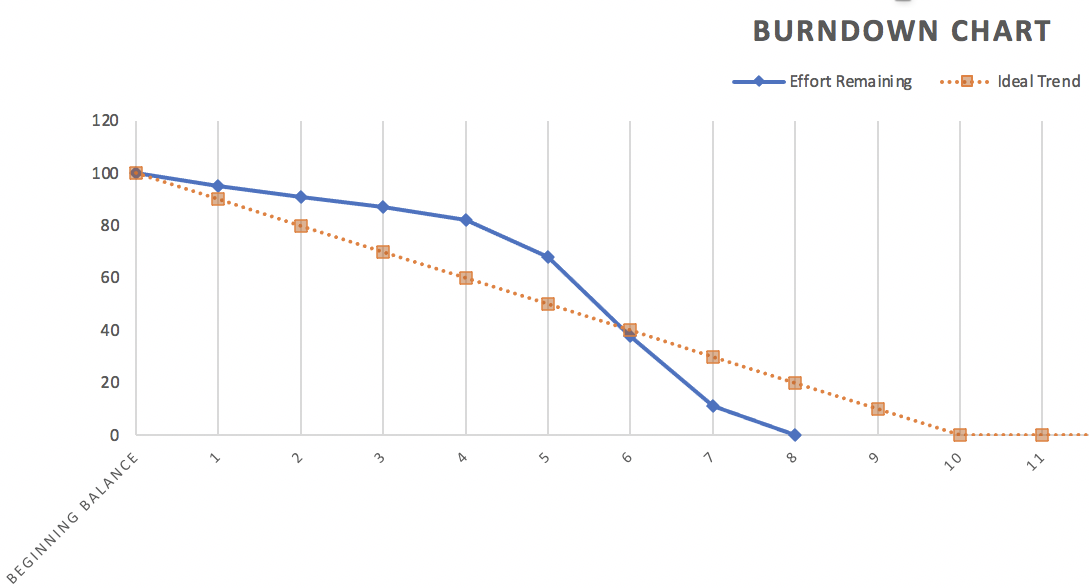 burn chart 2
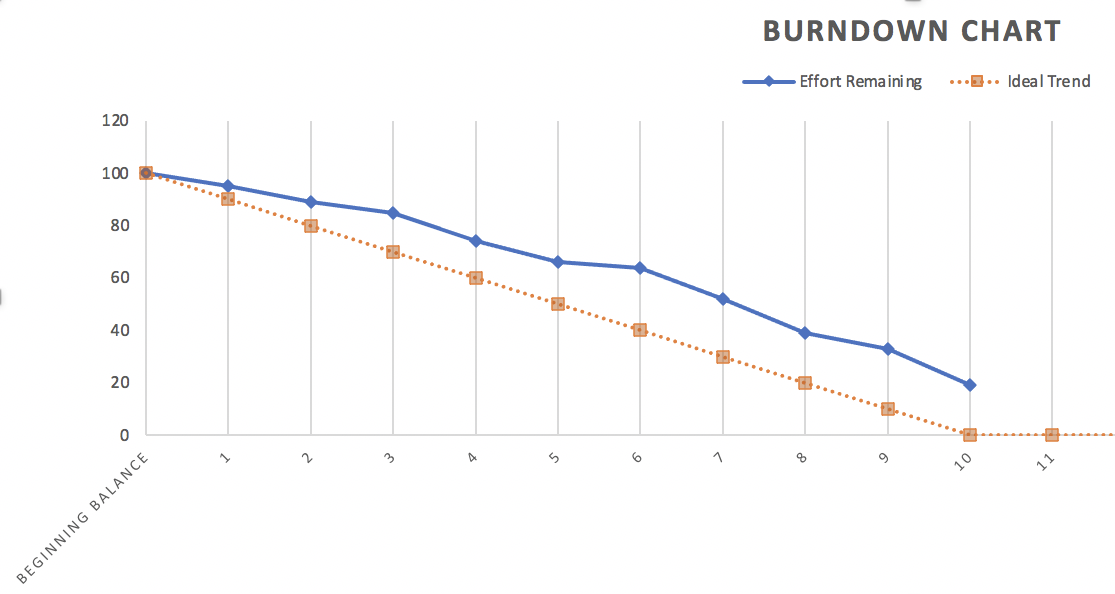 burn chart 3
Compare the charts provided. Be sure to cover the planned/committed velocity for the timeblock, the actual velocity, and the progress being made in each team. How is each team progressing, and when was/will the committed backlog be done, based on what is shown. If these are charts for three separate teams working on separate but related functionality, how would you evaluate the overall project?
BURNDOWN CHART Effort Remaining ..... Ideal Trend 120 100 80 60 40 20 0 2 3 1 8 9 o BEGINNING BALANCE BURNDOWN CHART Effort Remaining ..... Ideal Trend 120 100 80 60 40 20 0 2 33 5 1 BEGINNING BALANCE BURNDOWN CHART Effort Remaining ..... Ideal Trend 120 100 80 60 40 20 0 2 3 5 o 1 8 9 BEGINNING BALANCEStep by Step Solution
There are 3 Steps involved in it
1 Expert Approved Answer
Step: 1 Unlock

Question Has Been Solved by an Expert!
Get step-by-step solutions from verified subject matter experts
Step: 2 Unlock
Step: 3 Unlock