

Question: Bus 3330: STATISTICAL PROCESS CONTROL As a manager for T.G.I. Friday's one of your main concerns is customer wait time. Over the past week you
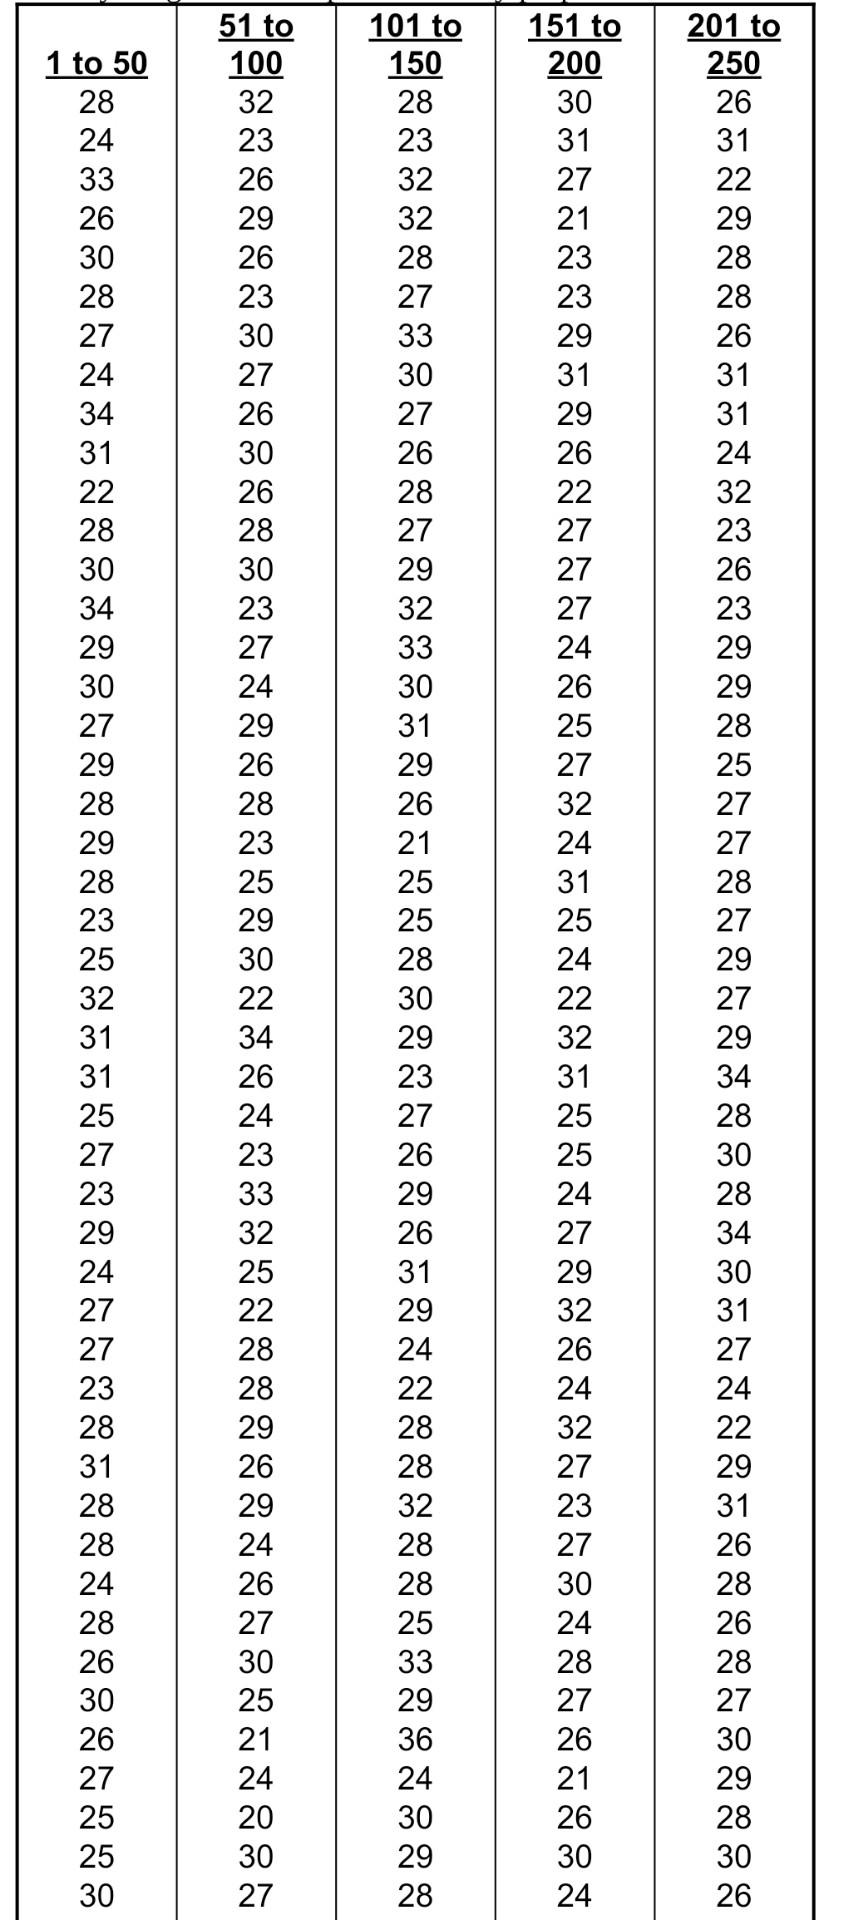
Bus 3330: STATISTICAL PROCESS CONTROL As a manager for T.G.I. Friday's one of your main concerns is customer wait time. Over the past week you have measured the amount of time it takes from when the customer places his/her order with the server until the food is delivered, see reverse side for 250 data points (there is an Excel spreadsheet in Brighspace with the observations). Your district manager has asked you to perform SPC on the data to see, amongst other things, if the process is in control and whether or not you can meet customer requirements. With this in mind, develop a memo to your boss that addresses the following issues: a.) Create 25 subgroups and calculate the average and range for each subgroup. Discuss the strategy you used to create your subgroups. NOTES -- 1.) Do NOT use all 250 observations...remember SPC charts are based on random sampling 2.) You do NOT have to show hand calculations for the means and ranges of these subgroups b.) Develop both an R-chart and an X-bar chart. Show and label all calculations. Are both variables in control? Justify your answer. c.) Use a cause and effect diagram to show scenarios that detail potential assignable causes that could lead to an x-bar chart to be out of control use the 4M method when doing this. Are there any ways you could try to prevent those errors from happening? d.) Customers expect an average wait time of 25 minutes. They are willing to accept times between 20 and 30 minutes. Is your process capable of meeting these targets? Please show and label all calculations. 201 to 250 26 51 to 100 32 23 26 29 101 to 150 28 23 32 32 151 to 200 30 31 27 21 31 26 28 23 23 27 23 29 1 to 50 28 24 33 26 30 28 27 24 34 31 22 28 30 34 29 30 27 29 30 27 26 30 26 22 29 28 28 26 31 31 24 32 23 26 23 29 29 28 25 33 30 27 26 28 27 29 32 33 30 31 29 26 21 25 28 30 23 27 24 29 26 28 23 31 29 26 22 27 27 27 24 26 25 27 28 32 27 24 31 25 25 25 29 30 22 34 26 24 23 33 32 25 22 28 30 29 23 27 26 24 22 32 31 25 25 27 28 27 29 27 29 34 28 30 29 24 28 26 31 29 27 29 32 28 24 26 29 28 23 25 32 31 31 25 27 23 29 24 27 27 23 28 31 28 28 24 28 26 30 26 27 25 25 30 28 24 29 26 29 24 26 27 30 25 21 24 20 30 27 22 28 28 32 28 28 25 33 29 36 24 30 29 28 32 27 23 27 30 24 28 27 26 21 34 30 31 27 24 22 29 31 26 28 26 28 27 30 29 28 30 26 26 30 24 Bus 3330: STATISTICAL PROCESS CONTROL As a manager for T.G.I. Friday's one of your main concerns is customer wait time. Over the past week you have measured the amount of time it takes from when the customer places his/her order with the server until the food is delivered, see reverse side for 250 data points (there is an Excel spreadsheet in Brighspace with the observations). Your district manager has asked you to perform SPC on the data to see, amongst other things, if the process is in control and whether or not you can meet customer requirements. With this in mind, develop a memo to your boss that addresses the following issues: a.) Create 25 subgroups and calculate the average and range for each subgroup. Discuss the strategy you used to create your subgroups. NOTES -- 1.) Do NOT use all 250 observations...remember SPC charts are based on random sampling 2.) You do NOT have to show hand calculations for the means and ranges of these subgroups b.) Develop both an R-chart and an X-bar chart. Show and label all calculations. Are both variables in control? Justify your answer. c.) Use a cause and effect diagram to show scenarios that detail potential assignable causes that could lead to an x-bar chart to be out of control use the 4M method when doing this. Are there any ways you could try to prevent those errors from happening? d.) Customers expect an average wait time of 25 minutes. They are willing to accept times between 20 and 30 minutes. Is your process capable of meeting these targets? Please show and label all calculations. 201 to 250 26 51 to 100 32 23 26 29 101 to 150 28 23 32 32 151 to 200 30 31 27 21 31 26 28 23 23 27 23 29 1 to 50 28 24 33 26 30 28 27 24 34 31 22 28 30 34 29 30 27 29 30 27 26 30 26 22 29 28 28 26 31 31 24 32 23 26 23 29 29 28 25 33 30 27 26 28 27 29 32 33 30 31 29 26 21 25 28 30 23 27 24 29 26 28 23 31 29 26 22 27 27 27 24 26 25 27 28 32 27 24 31 25 25 25 29 30 22 34 26 24 23 33 32 25 22 28 30 29 23 27 26 24 22 32 31 25 25 27 28 27 29 27 29 34 28 30 29 24 28 26 31 29 27 29 32 28 24 26 29 28 23 25 32 31 31 25 27 23 29 24 27 27 23 28 31 28 28 24 28 26 30 26 27 25 25 30 28 24 29 26 29 24 26 27 30 25 21 24 20 30 27 22 28 28 32 28 28 25 33 29 36 24 30 29 28 32 27 23 27 30 24 28 27 26 21 34 30 31 27 24 22 29 31 26 28 26 28 27 30 29 28 30 26 26 30 24
Step by Step Solution
There are 3 Steps involved in it
1 Expert Approved Answer
Step: 1 Unlock

Question Has Been Solved by an Expert!
Get step-by-step solutions from verified subject matter experts
Step: 2 Unlock
Step: 3 Unlock