

Question: BUS 511 CASE 4 CPA BEC S3 Cummings Corp. case Memo: August Production Data Memo To: All Cummings Corp. From: James Blake, manager-Plumbing Parts division
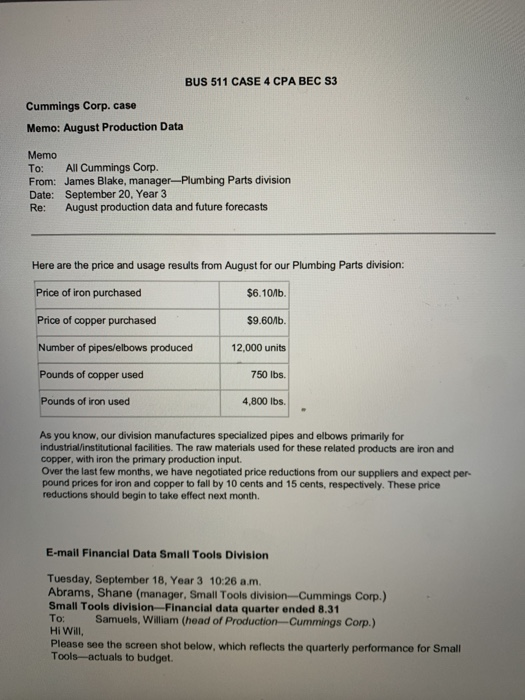
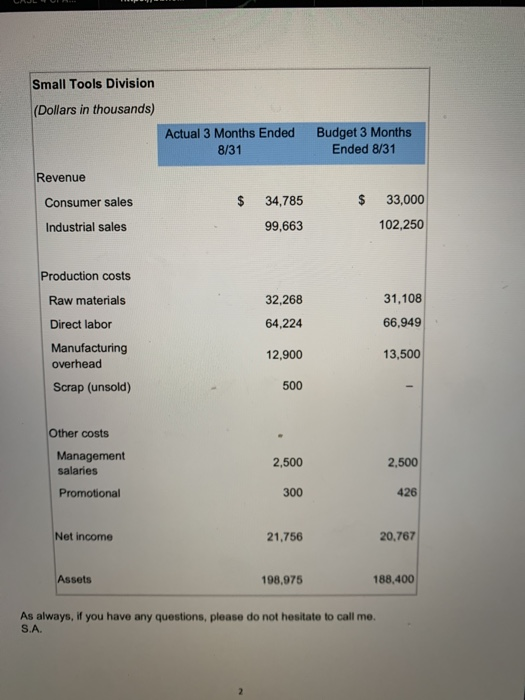
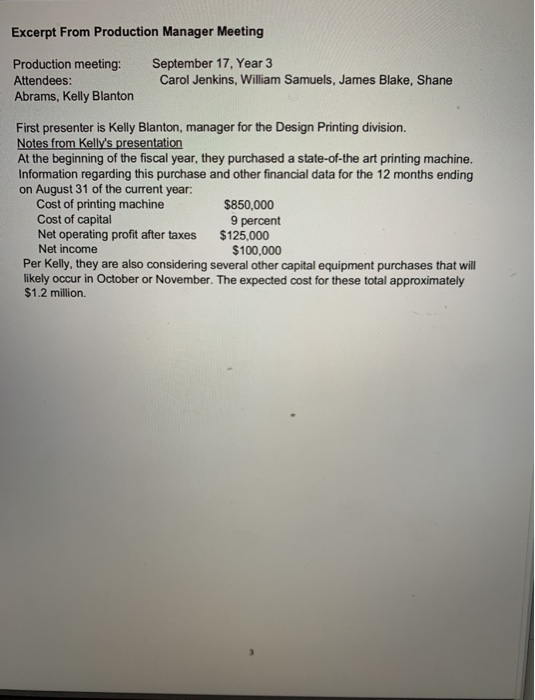
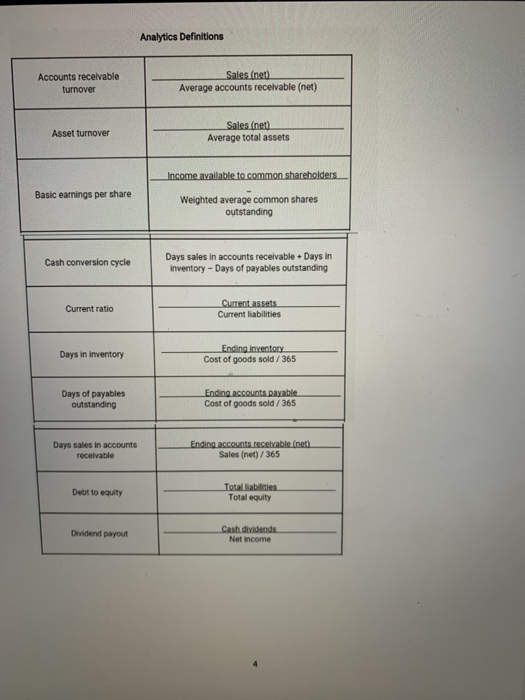
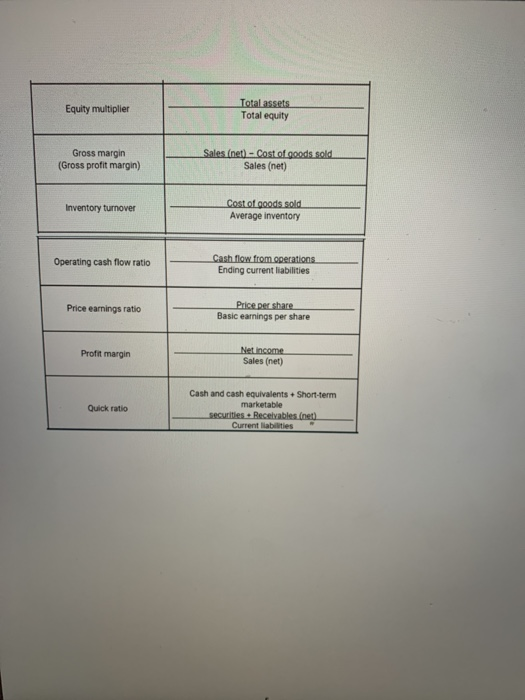
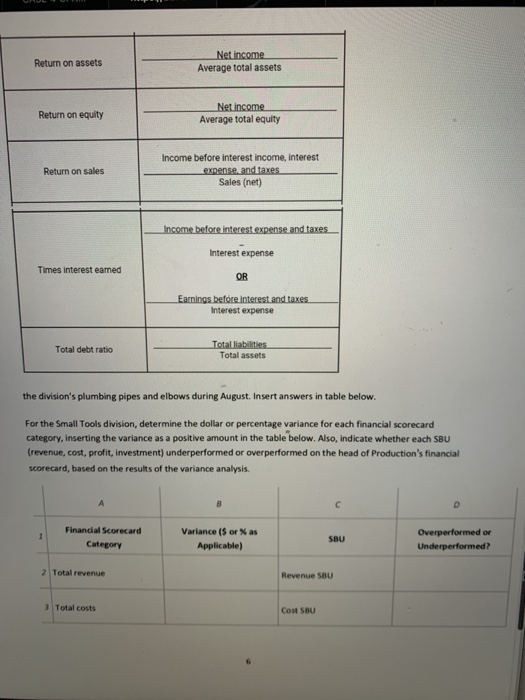
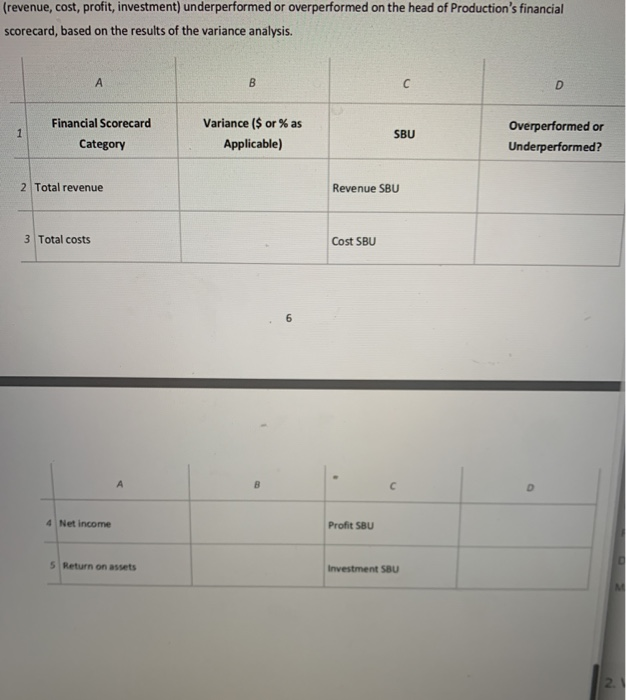
BUS 511 CASE 4 CPA BEC S3 Cummings Corp. case Memo: August Production Data Memo To: All Cummings Corp. From: James Blake, manager-Plumbing Parts division Date: September 20, Year 3 Re: August production data and future forecasts Here are the price and usage results from August for our Plumbing Parts division: Price of iron purchased $6.10/b. Price of copper purchased $9.60/lb. Number of pipes/elbows produced 12,000 units Pounds of copper used 750 lbs. Pounds of iron used 4,800 lbs. As you know, our division manufactures specialized pipes and elbows primarily for industrial/institutional facilities. The raw materials used for these related products are iron and copper, with iron the primary production input. Over the last few months, we have negotiated price reductions from our suppliers and expect per pound prices for iron and copper to fall by 10 cents and 15 cents, respectively. These price reductions should begin to take effect next month. E-mail Financial Data Small Tools Division Tuesday, September 18, Year 3 10:26 a.m. Abrams, Shane (manager, Small Tools division Cummings Corp.) Small Tools division Financial data quarter ended 8.31 To: Samuels, William (head of Production Cummings Corp.) Hi Will, Please see the screen shot below, which reflects the quarterly performance for Small Tools actuals to budget. Small Tools Division (Dollars in thousands) Actual 3 Months Ended 8/31 Budget 3 Months Ended 8/31 Revenue Consumer sales $ 34,785 $ 33,000 102,250 Industrial sales 99,663 Production costs Raw materials 32,268 64,224 31,108 66,949 Direct labor 12,900 13,500 Manufacturing overhead Scrap (unsold) 500 Other costs Management salaries Promotional 2,500 2,500 300 426 Net income 21,756 20,767 Assets 198,975 188.400 As always, if you have any questions, please do not hesitate to call me. S.A Excerpt From Production Manager Meeting Production meeting: Attendees: Abrams, Kelly Blanton September 17, Year 3 Carol Jenkins, William Samuels, James Blake, Shane First presenter is Kelly Blanton, manager for the Design Printing division. Notes from Kelly's presentation At the beginning of the fiscal year, they purchased a state-of-the art printing machine. Information regarding this purchase and other financial data for the 12 months ending on August 31 of the current year: Cost of printing machine $850,000 Cost of capital 9 percent Net operating profit after taxes $125,000 Net income $100,000 Per Kelly, they are also considering several other capital equipment purchases that will likely occur in October or November. The expected cost for these total approximately $1.2 million. Analytics Definitions Accounts receivable turnover Sales (net Average accounts receivable (net) Asset turnover Sales.net Average total assets Income available to common shareholders Basic earnings per share Weighted average common shares outstanding Cash conversion cycle Days sales in accounts receivableDays in Inventory - Days of payables outstanding Current ratio Current assets Current liabilities Days in inventory Ending inventory Cost of goods sold /365 Days of payables outstanding Ending accounts payable Cost of goods sold / 365 Days sales in accounts receivable Ending accounts receivable net Sales (net)/365 Debt to equity Totes Total equity Dividend payout Cashdodends Net income Equity multiplier Totalassets Total equity Gross margin (Gross profit margin) Sales (net) - Cost of goods sold Sales (net) Inventory turnover Cost of goods sold Average inventory Operating cash flow ratio Cash flow from operations Ending current liabilities Price earnings ratio Price per share Basic earnings per share Profit margin Net Income Sales (net) Quick ratio Cash and cash equivalents Short-term marketable securities. Receivables.net Current es Return on assets Net income Average total assets Return on equity Net income Average total equity Return on sales Income before interest income, interest Unse and taxes Sales (net) Income before interest expense and taxes Interest expense Times interest eamed Earnings before interest and taxes Interest expense Total debt ratio Total liabilities Total assets the division's plumbing pipes and elbows during August. Insert answers in table below. For the Small Tools division, determine the dollar or percentage variance for each financial scorecard category, inserting the variance as a positive amount in the table below. Also, indicate whether each SBU trevenue, cost, profit, investment) underperformed or overperformed on the head of Production's financial scorecard, based on the results of the variance analysis Financial Scorecard Category Variance ($ oras Applicable) SBU Overperformed or Underperformed? 2 Total revenue Revenue SBU Total costs Cost SBU (revenue, cost, profit, investment) underperformed or overperformed on the head of Production's financial scorecard, based on the results of the variance analysis. Financial Scorecard Category Variance ($ or % as Applicable) SBU Overperformed or Underperformed? 2 Total revenue Revenue SBU 3 Total costs Cost SBU 4 Net Income Profit SBU 5 Return on assets Investment SBU
Step by Step Solution
There are 3 Steps involved in it

Get step-by-step solutions from verified subject matter experts