

Question: business analytics 2 2. Start with an Introduction section which should be about 300-500 words. Introduce your research question and explain the importance of analyzing
business analytics 2
2. Start with an Introduction section which should be about 300-500 words. Introduce your research question and explain the importance of analyzing it. What is your y variable and what are your explanatory (x) variables? Explain the purpose of selecting those x variables to analyze your y. Should they increase or decrease your main variable, y? Explain what you expect from each x carefully. If you chose to collect your own data set, also discuss your data collection methods and any challenges you may have run into. 3. Proceed with a Findings section. (a) Run the descriptive statistics of Excel to find the descriptive measures of your variables. This is where you familiarize the reader with the data set. Copy and paste the descriptive statistics into the word document. Discuss the averages, minimums and maximums, and any interesting observation you can make regarding the descriptive statistics. Does anything seem unusual or unexpected? Explain. (b) Insert a graph of your y variable against your x variables individually. You can use a scatter-plot for the quantitative x's and a bar chart for the dummy variables. Explain each graph/chart with a sentence. (c) Write the functional form of your regression model.(d) Use Excel and SPSS to run a regression. Copy and paste the regression results into your word document. (e) Discuss the strength and the significance of your regression model by using R-square and significance- F where = 0.05. (f) Now check for multicollinearity using SPSS. Copy and paste your results to your word document.This can be a table including the VIF's for each variable. Explain if you see a multi- collinearity issue in your regression. What are the consequences of multicollinearity for a regression, in general? If your regression has a multicollinearity problem, how would you proceed to fix the issue? (g) If multicollinearity exists in your regression, try to fix the problem and copy and paste the new results. (h) Interpret each coefficient estimate and discuss its significance using = 0.01, = 0.05 and = 0.10. Use the concepts of strict and weak significance too. When interpreting the coefficients, remember to cover the sign, size, and significance of the estimates. Make sure that you use the correct units for your variables in your interpretations. (i) Usethecoefficientestimatestowritethepredictionequation(y). (j) Make a reliable prediction based on this prediction equation. 2 (k) Run two more regressions with different combinations of your x's to see if you can find an improvement over your main regression. Copy and paste the results of these alternative regressions. By using your model choice criteria, explain clearly which regression is better than others. 4. Finish with a Conclusion section, which should be about 250-300 words. Tie this section to the Introduction. Remind your research question to the reader and summarize what you have found. Explain your findings briefly and make clear and practical recommendations based on your findings. Make sure that you discuss the implications of your results and possible reasons for why they occurred in a simple, clear, and concise manner. You can use the following questions as guidance (do not limit yourself to these questions): How could these results be used and by whom? Why are these results important? What recommendations would you make based on these results? 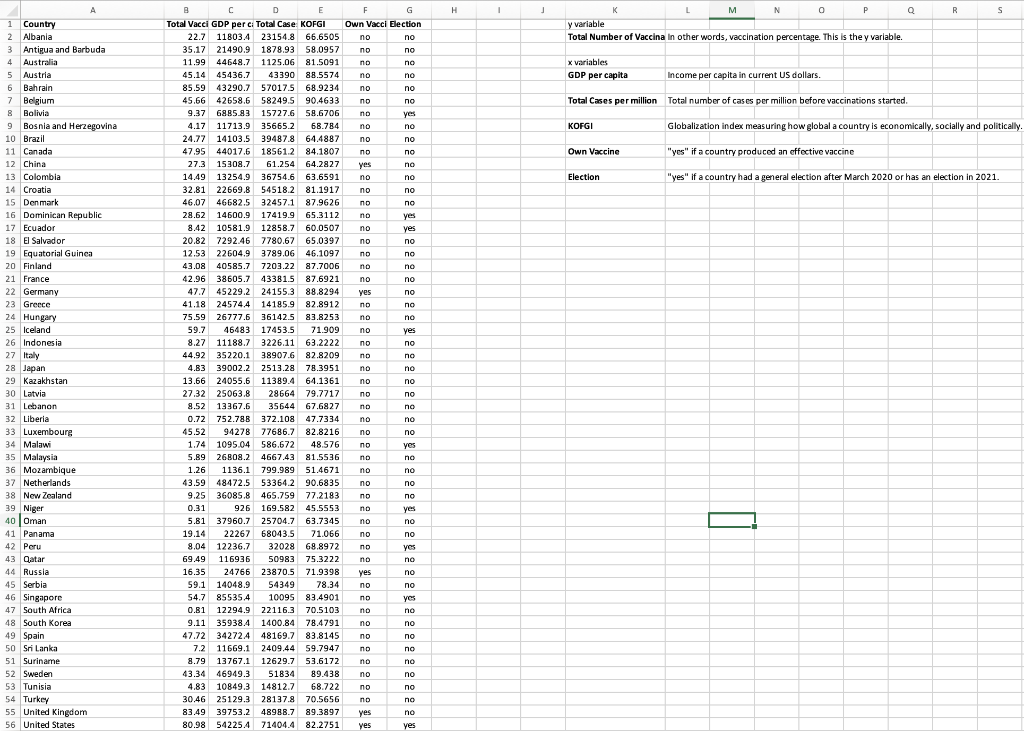
Step by Step Solution
There are 3 Steps involved in it

Get step-by-step solutions from verified subject matter experts