

Question: (Business Analytics II) 2. Start with an Introduction section which should be about 100-300 words. Introduce your research question. What is your y variable and
(Business Analytics II)
2. Start with an Introduction section which should be about 100-300 words. Introduce your research question. What is your y variable and what are your explanatory (x) variables? Explain the purpose of selecting those x variables to analyze your y. Should they increase or decrease your main variable, y? Explain what you expect from each and every x carefully
3. Proceed with a Findings section.
- Run the descriptive statistics in Excel to find the descriptive measures of all your variables. This is where you familiarize the reader with the data set. Copy and paste the descriptive statistics into the word document. Discuss the averages, minimums and maximums, and any interesting observation you can make regarding the descriptive statistics.
- Insert a graph of your y variable against your x variables individually. You can use a scatter-plot for the quantitative x's and a bar chart for the qualitative x variables. What type of a relationship (linear or non-linear) are the graphs suggesting? Explain each graph/chart with a sentence.
- Write the functional form of your regression model.
- Use Excel to run a regression. Copy and paste the regression results into your word document. Write down your estimated regression.
- Explain the R-square in your regression.
- Discuss the significance of your regression model by using significance- F where = 0.10.
- Interpret each estimated coefficient and discuss its significance using = 0.10.
- Now check for multicollinearity using Excel. Copy and paste your results (correlation coefficient table) to your word document. Explain if you see a multicollinearity issue in your regression. What are the consequences of multicollinearity for a regression, in general?
- If multicollinearity exists in your regression, try to fix the problem and copy and paste the new results.
4. Finish with a Conclusion section. Tie this section to the Introduction. Remind your research question to the reader and summarize what you have found. You do not have to be too specific here. But explain your findings briefly and make recommendations based on your findings. This section should be about 200-300 words.
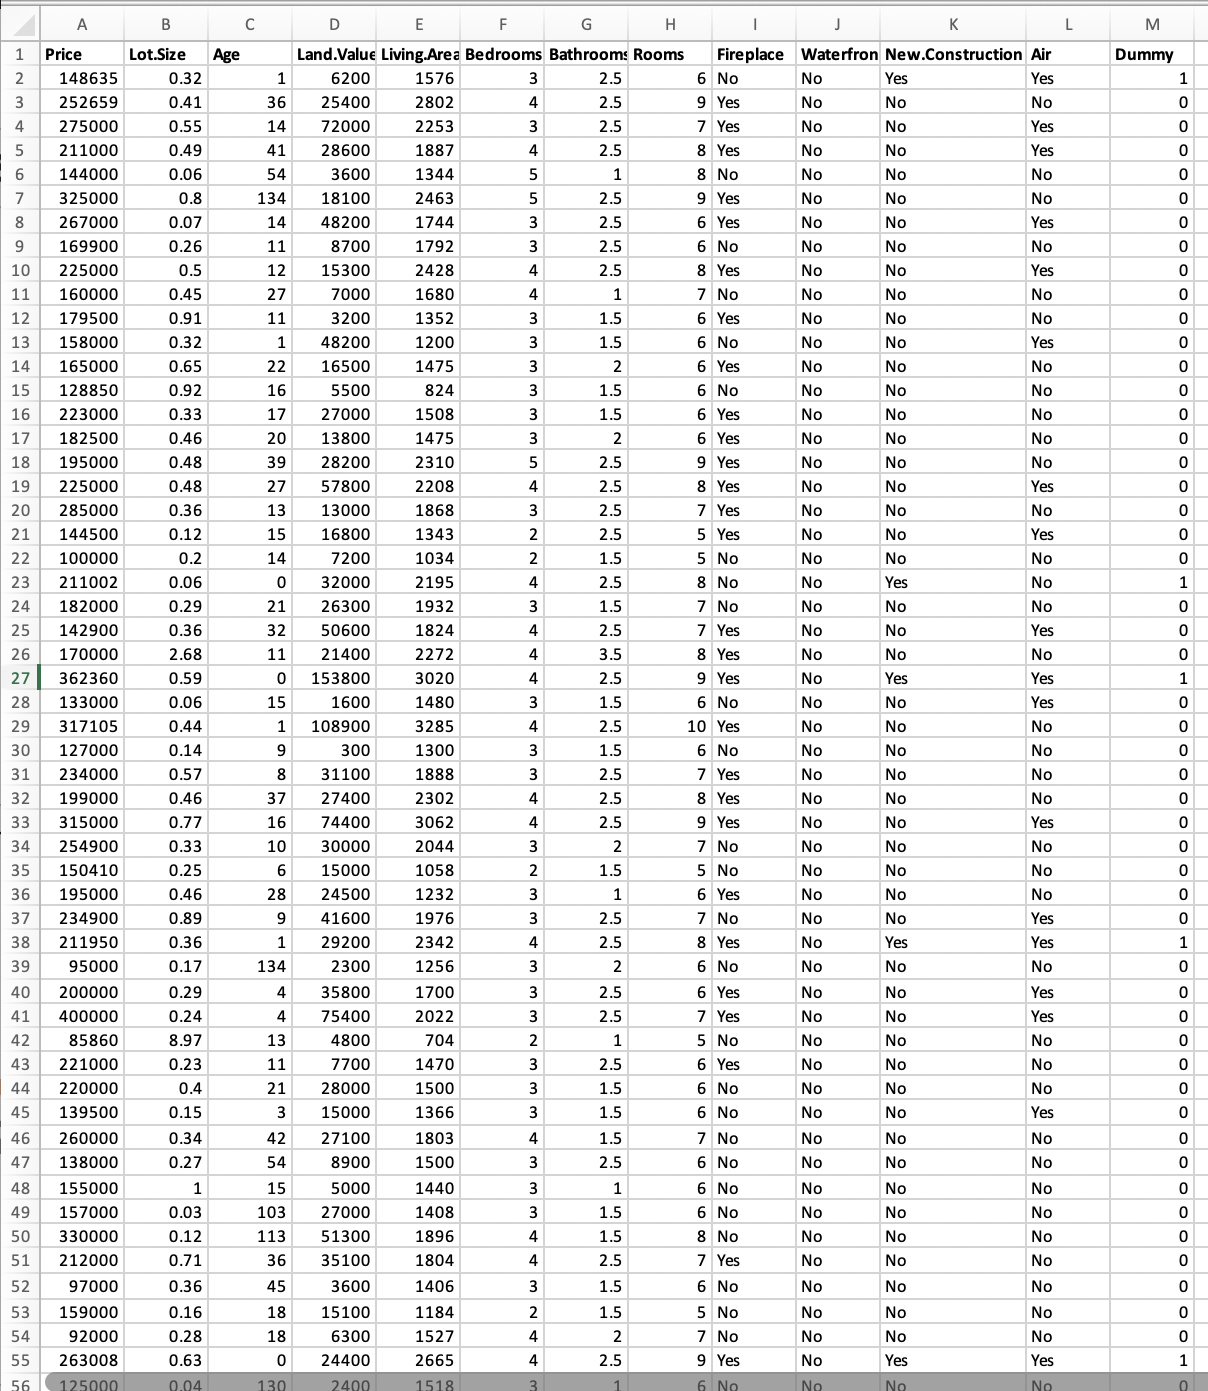
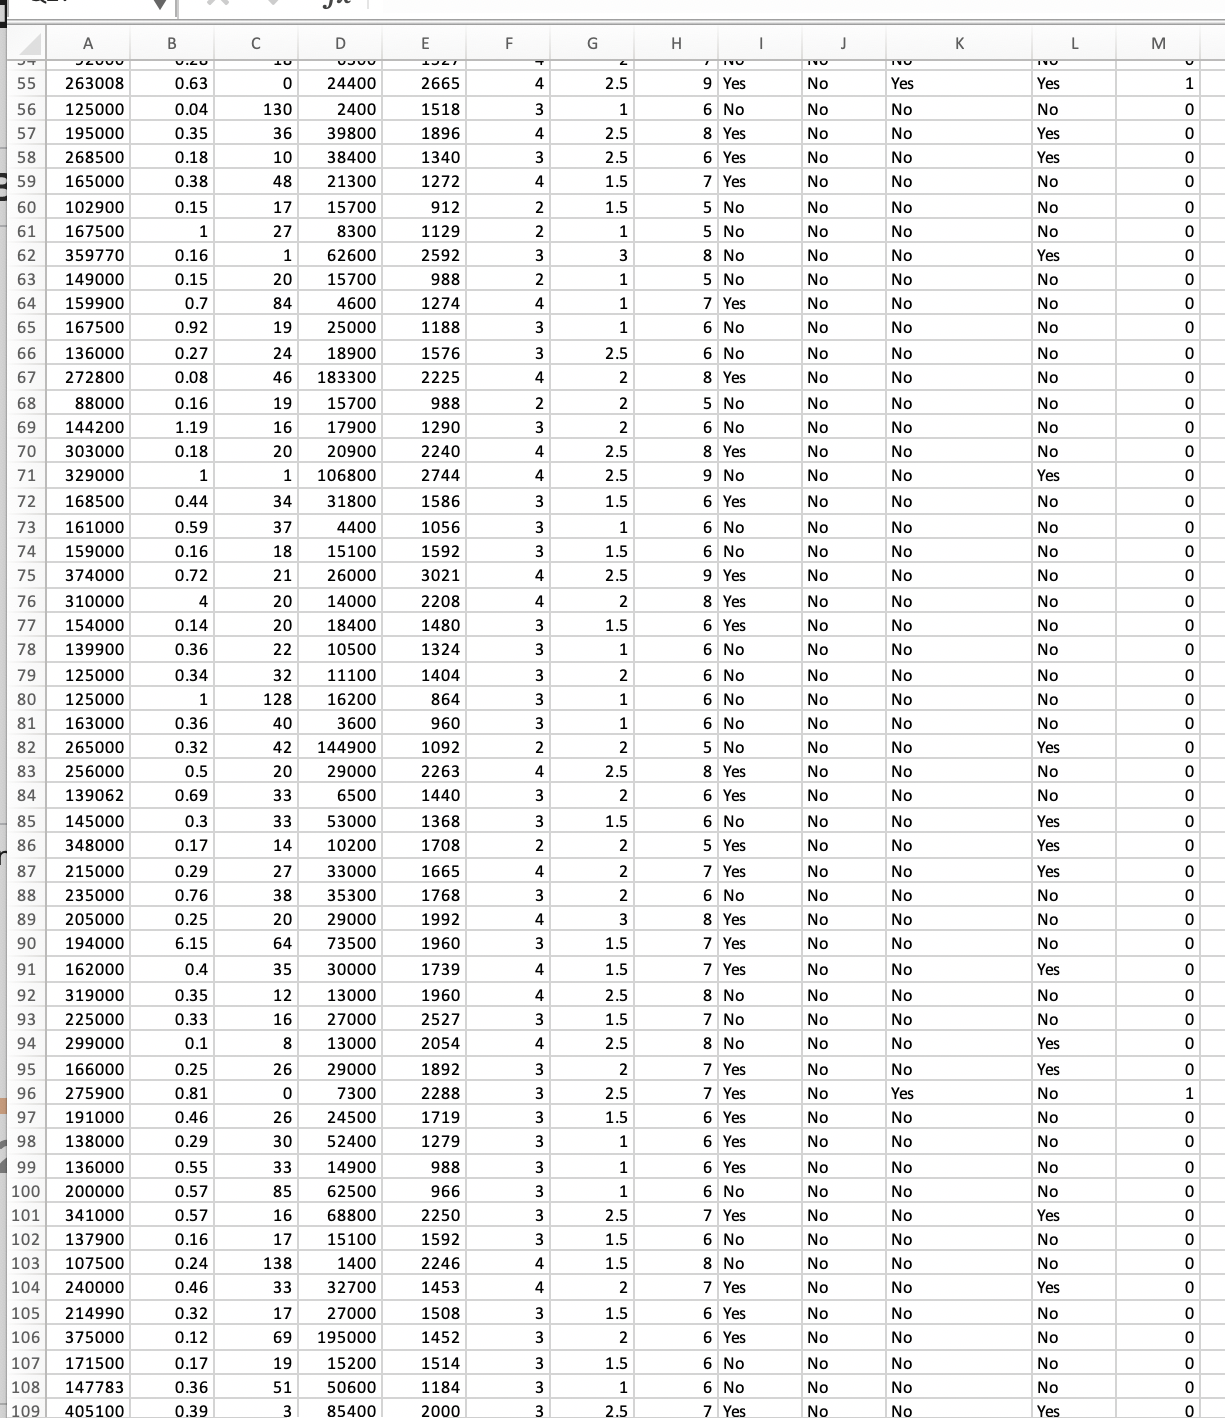
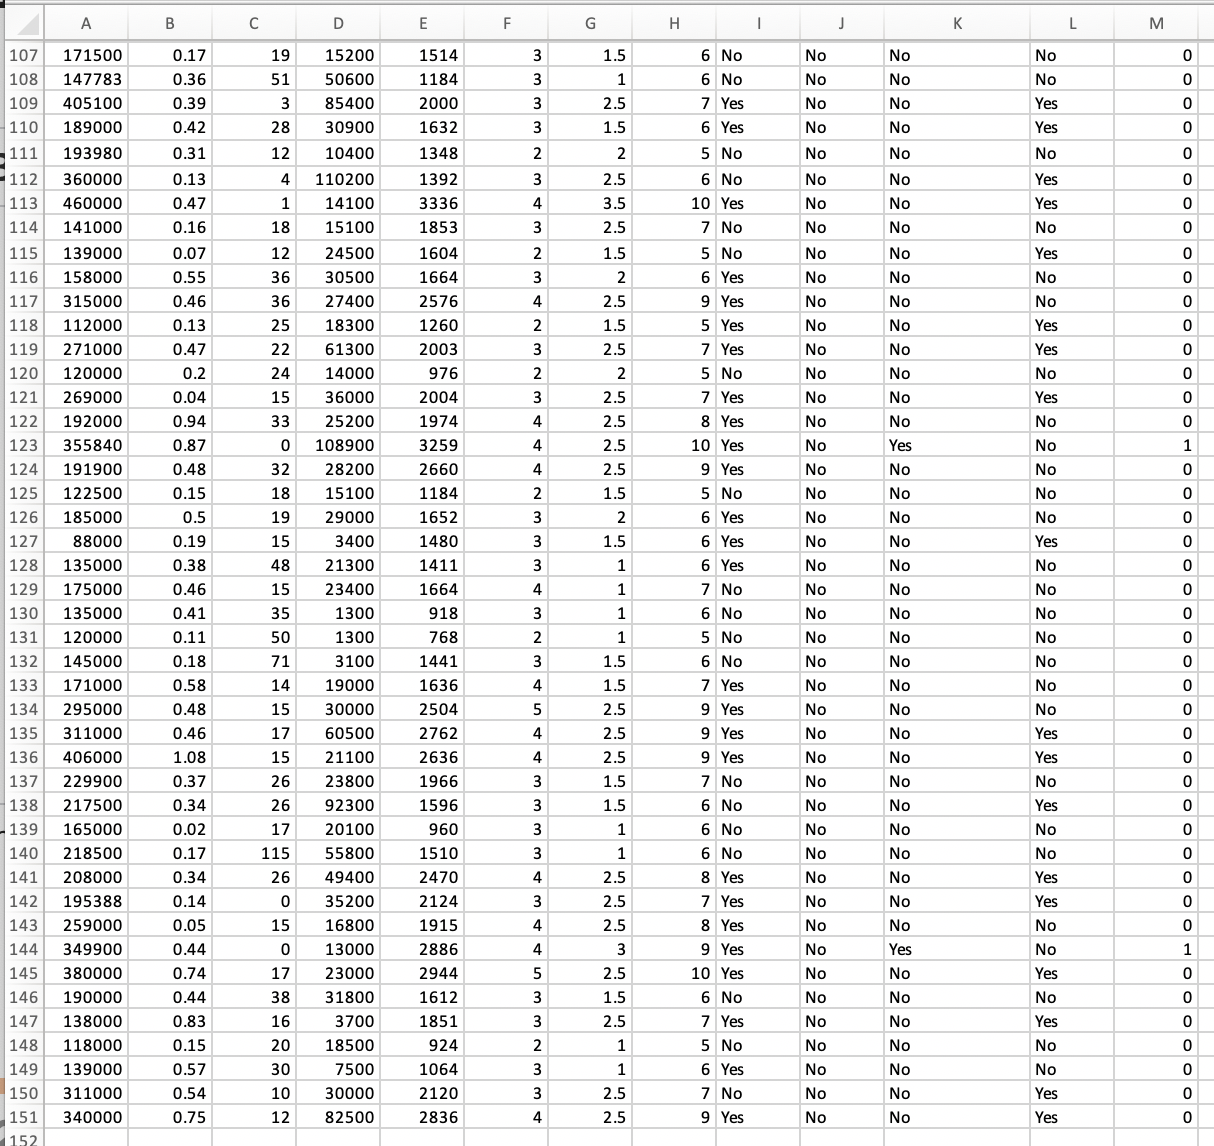
This is the dataset:
Step by Step Solution
There are 3 Steps involved in it

Get step-by-step solutions from verified subject matter experts