

Question: BUSINESS ANALYTICS AND BIG DATA In this section, you need to present and summarize the results from your statistical analysis. in particular. the results section
BUSINESS ANALYTICS AND BIG DATA
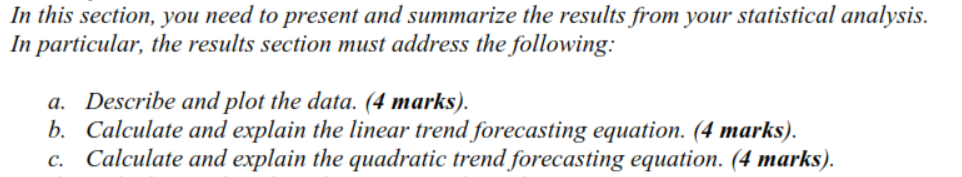
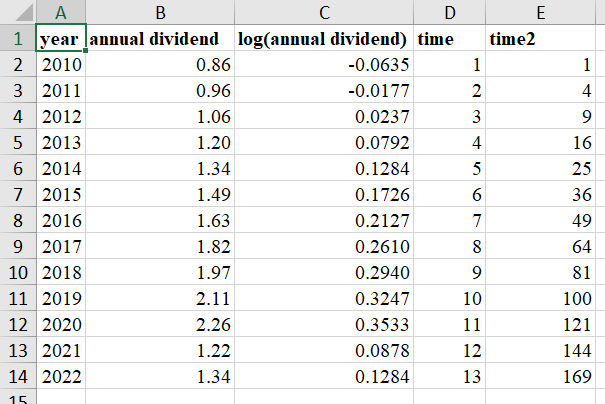
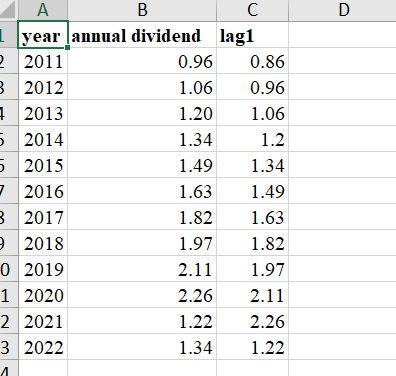
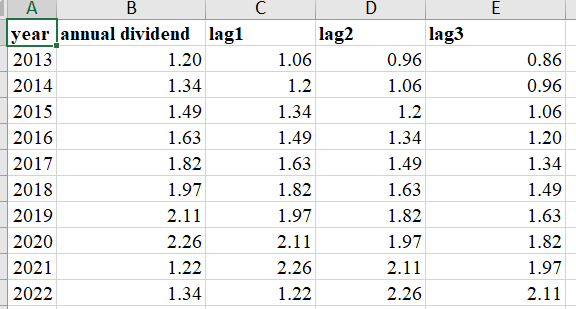
In this section, you need to present and summarize the results from your statistical analysis. in particular. the results section must address the following: a. Describe and plot the data. (4 marks). b. Calculate and explain the linear trena1 forecasting equation. (4 marks). c. Calculate and explain the quadratic trend forecasting equation. (4' marks). \fA B C D year annual dividend lagl 2011 0.96 0.86 2012 1.06 0.96 2013 1.20 1.06 2014 1.34 1.2 2015 1.49 1.34 2016 1.63 1.49 2017 1.82 1.63 2018 1.97 1.82 0 2019 2.11 1.97 2020 2.26 2.11 2 2021 1.22 2.26 3 2022 1.34 1.22\fA B C D E year annual dividend lagl lag2 lag3 2013 1.20 1.06 0.96 0.86 2014 1.34 1.2 1.06 0.96 2015 1.49 1.34 1.2 1.06 2016 1.63 1.49 1.34 1.20 2017 1.82 1.63 1.49 1.34 2018 1.97 1.82 1.63 1.49 2019 2.11 1.97 1.82 1.63 2020 2.26 2.11 1.97 1.82 2021 1.22 2.26 2.11 1.97 2022 1.34 1.22 2.26 2.11
Step by Step Solution
There are 3 Steps involved in it

Get step-by-step solutions from verified subject matter experts