

Question: business analytics Duo & Download G Ein Browser Excel OL HW-score data Data Re Draw Formulas Page Layout FI Home D 1 Consumer Transportation Survey
business analytics 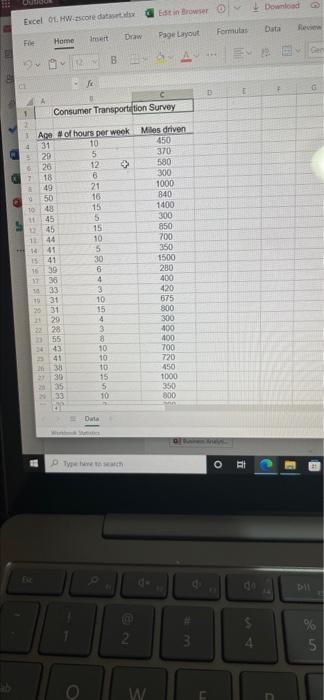
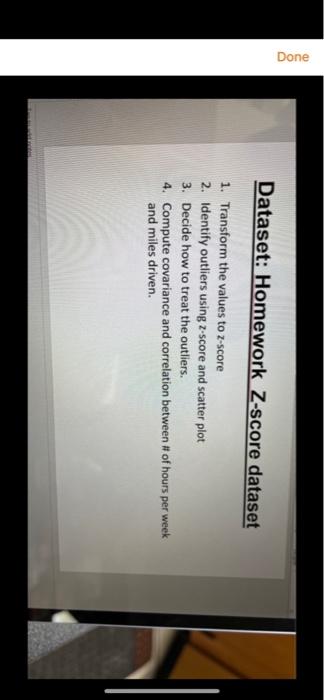
Duo & Download G Ein Browser Excel OL HW-score data Data Re Draw Formulas Page Layout FI Home D 1 Consumer Transportation Survey 4 1 Ace of hours per week Miles driven 4 31 10 450 5 370 12 580 17 18 B 300 21 1000 16 840 10 15 1400 300 15 850 44 10 700 +41 350 15 41 30 1500 1 39 280 38 400 420 31 10 675 31 15 800 20 300 22 28 400 400 3443 10 700 41 10 720 10 450 30 15 1000 35 350 33 10 300 :2g L a s g = en - am a = = = = = De o 2 3 % 5 W Done Dataset: Homework Z-score dataset 1. Transform the values to z-score 2. Identify outliers using 2.score and scatter plot 3. Decide how to treat the outliers. 4. Compute covariance and correlation between # of hours per week and miles driven. Duo & Download G Ein Browser Excel OL HW-score data Data Re Draw Formulas Page Layout FI Home D 1 Consumer Transportation Survey 4 1 Ace of hours per week Miles driven 4 31 10 450 5 370 12 580 17 18 B 300 21 1000 16 840 10 15 1400 300 15 850 44 10 700 +41 350 15 41 30 1500 1 39 280 38 400 420 31 10 675 31 15 800 20 300 22 28 400 400 3443 10 700 41 10 720 10 450 30 15 1000 35 350 33 10 300 :2g L a s g = en - am a = = = = = De o 2 3 % 5 W Done Dataset: Homework Z-score dataset 1. Transform the values to z-score 2. Identify outliers using 2.score and scatter plot 3. Decide how to treat the outliers. 4. Compute covariance and correlation between # of hours per week and miles driven Step by Step Solution
There are 3 Steps involved in it
1 Expert Approved Answer
Step: 1 Unlock

Question Has Been Solved by an Expert!
Get step-by-step solutions from verified subject matter experts
Step: 2 Unlock
Step: 3 Unlock