

Question: Business Analytics The linear trend forecasting equation for an annual time series containing 44 values (from 196-4. to 2007) on net sales (in billions ofdollars)
Business Analytics
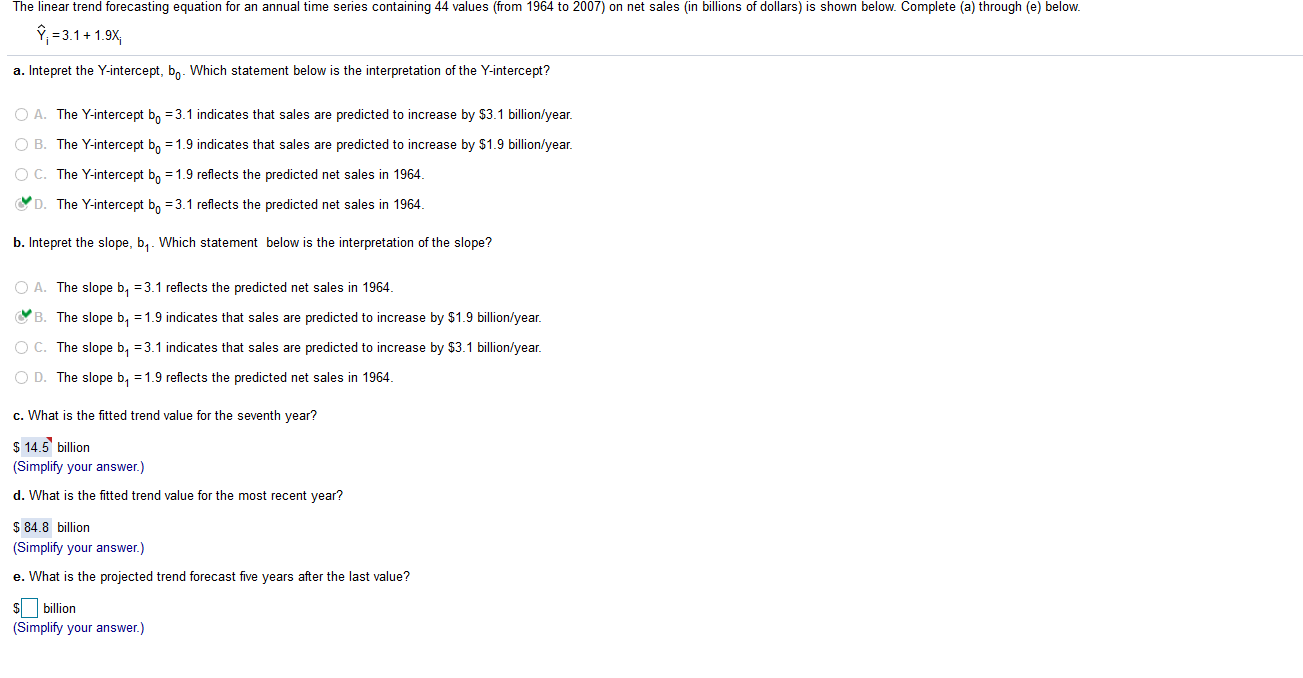
The linear trend forecasting equation for an annual time series containing 44 values (from 196-4. to 2007) on net sales (in billions ofdollars) is shown below. Complete (a) through (e) below. '?I=3_1+1_9XI a. lntepret the Yintercept, bu. Which statement below is the interpretation of the Yintercept? 1:; . The Yintercept bu =3.'1 indicates that sales are predicted to increase by $3.1 billionfyear. LU . The Yintercept b =13 indicates that sales are predicted to increase by $1.9 billioni'year. . The Yeintercept \"0 =19 reects the predicted net sales in 196-4. . The Yintercept bu 23.1 reects the predicted net sales in 1964. b. lntepret the slope, b1. Which statement below is the interpretation ofthe slope? ' r. The slope b1 =11 reects the predicted net sales in 1964. IV 3. The slope b1 =19 indicates that sales are predicted to increase by $1.9 billioniyear. . The slope b1 =3.1 indicates that sales are predicted to increase by $3.1 billioniyear. " '- 3. The slope b1 21.9 reects the predicted net sales in 19611. c. What is the tted trend value for the seventh year? $145 billion (Simplify your answer.) d. What is the tted trend value for the most recent year? 5 84.8 billion (Simplify your answer.) is. What is the projected trend forecast ve years alter the last value? 55 billion (Simplify your answer.)
Step by Step Solution
There are 3 Steps involved in it

Get step-by-step solutions from verified subject matter experts