

Question: Business Analytics The linear trend forecasting equation for an annual time series containing 44 values (from 1964 to 2007) on net sales (in billions of
Business Analytics
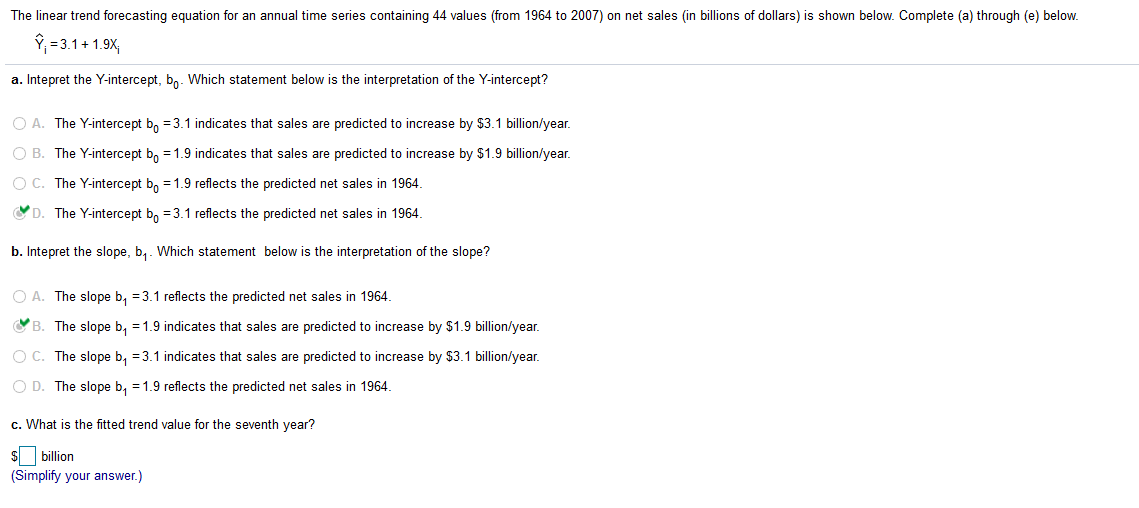
The linear trend forecasting equation for an annual time series containing 44 values (from 1964 to 2007) on net sales (in billions of dollars) is shown below. Complete (a) through (e) below. Y. = 3.1 + 1.9%; a. Intepret the Y-intercept, bo- Which statement below is the interpretation of the Y-intercept? O A. The Y-intercept bo =3.1 indicates that sales are predicted to increase by $3.1 billion/year. O B. The Y-intercept bo = 1.9 indicates that sales are predicted to increase by $1.9 billion/year. O C. The Y-intercept bo = 1.9 reflects the predicted net sales in 1964. D. The Y-intercept bo =3.1 reflects the predicted net sales in 1964. b. Intepret the slope, by - Which statement below is the interpretation of the slope? O A. The slope by =3.1 reflects the predicted net sales in 1964. B. The slope by = 1.9 indicates that sales are predicted to increase by $1.9 billion/year. O C. The slope by =3.1 indicates that sales are predicted to increase by $3.1 billion/year. O D. The slope by =1.9 reflects the predicted net sales in 1964. c. What is the fitted trend value for the seventh year? 5 billion (Simplify your answer.)
Step by Step Solution
There are 3 Steps involved in it

Get step-by-step solutions from verified subject matter experts