Question: Business Background: Question 3 - Continued from Question 3-20 points Company A makes two types of product, X and Y. The product tree (Bill of
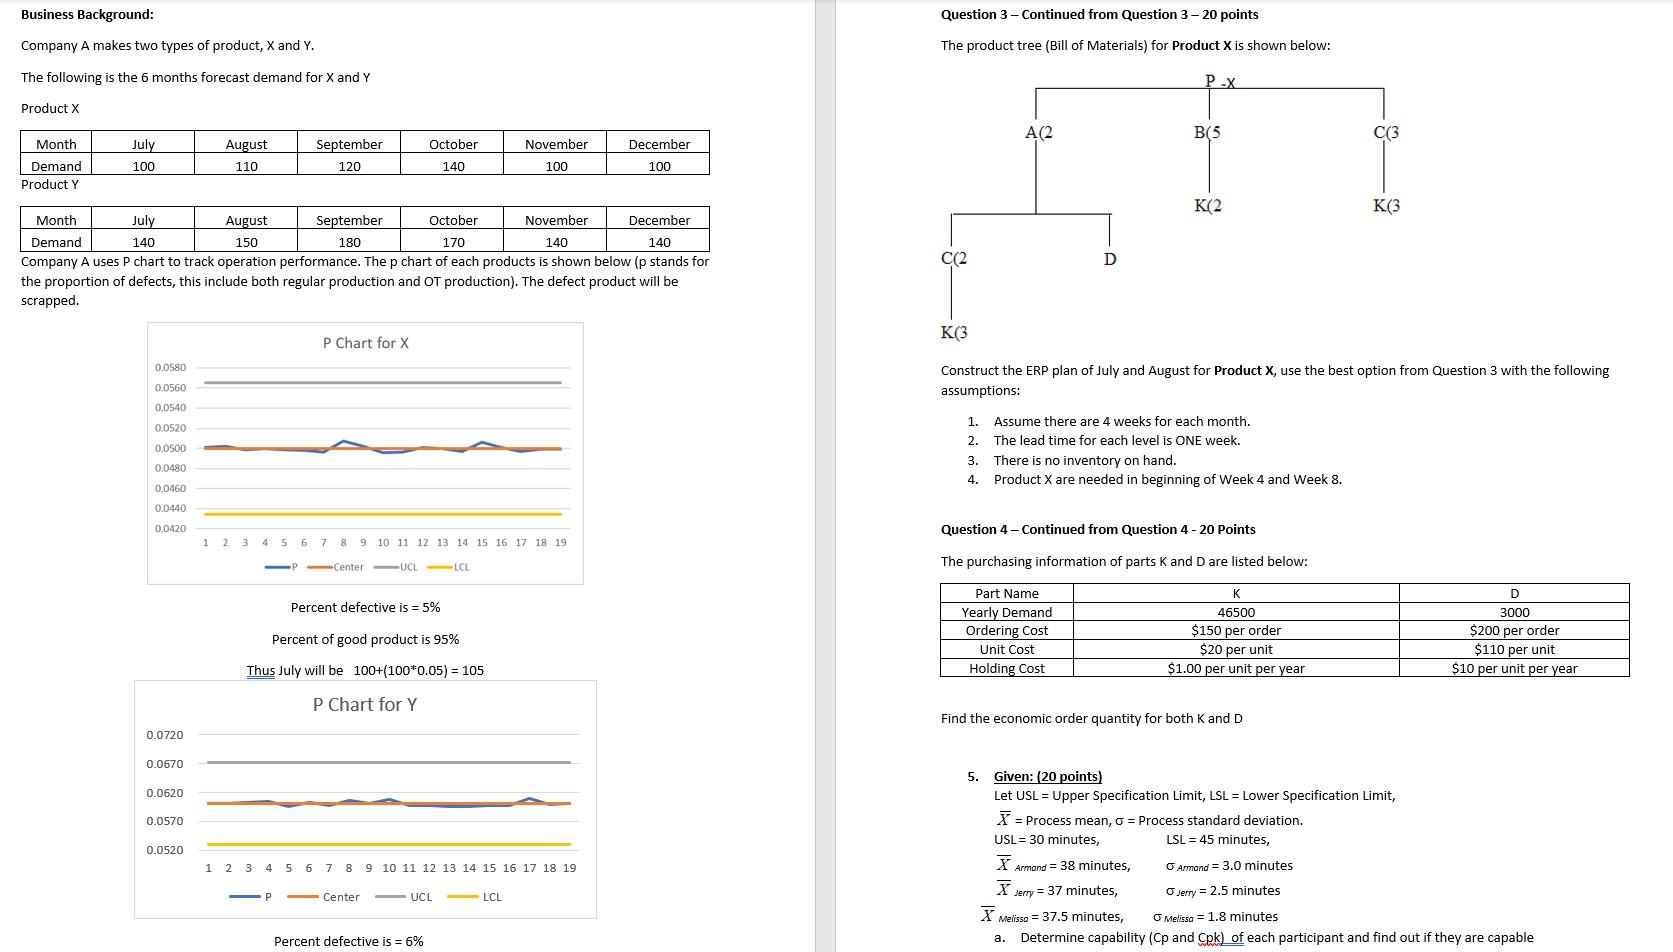

Business Background: Question 3 - Continued from Question 3-20 points Company A makes two types of product, X and Y. The product tree (Bill of Materials) for Product X is shown below: The following is the 6 months forecast demand for X and Y P-X Product X A(2 B(5 C(3 Month Demand Product Y July 100 August 110 September 120 October 140 November 100 December 100 K(2 K(3 Month July August September October November December Demand 140 150 180 170 140 140 Company A uses P chart to track operation performance. The p chart of each products is shown below (p stands for the proportion of defects, this include both regular production and OT production). The defect product will be scrapped. C(2 D K(3 P Chart for X 0.0580 0.0560 Construct the ERP plan of July and August for Product X, use the best option from Question 3 with the following assumptions: 0.0540 0.0520 0.0500 0.0480 1. Assume there are 4 weeks for each month. 2. The lead time for each level is ONE week. 3. There is no inventory on hand. 4. Product X are needed in beginning of Week 4 and Week 8. 0.0460 0.0440 0.0420 Question 4-Continued from Question 4 -20 Points 1 2 3 4 5 6 7 8 9 10 11 12 13 14 15 16 17 18 19 -P-Center UCLLCL The purchasing information of parts K and D are listed below: Percent defective is = 5% Percent of good product is 95% Part Name Yearly Demand Ordering Cost Unit Cost Holding Cost K 46500 $150 per order $20 per unit $1.00 per unit per year D 3000 $200 per order $110 per unit $10 per unit per year Thus July will be 100+(100*0.05) = 105 P Chart for Y Find the economic order quantity for both and D 0.0720 0.0670 0.0620 0.0570 0.0520 5. Given: 20 points) Let USL = Upper Specification Limit, LSL = Lower Specification Limit, X = Process mean, o = Process standard deviation. USL = 30 minutes, LSL = 45 minutes, Armand = 38 minutes, Armand = 3.0 minutes X Jerry = 37 minutes, Jerry = 2.5 minutes X Melisse = 37.5 minutes, Melissa = 1.8 minutes a. Determine capability (Cp and Cpk) of each participant and find out if they are capable 1 2 3 4 5 6 7 8 9 10 11 12 13 14 15 16 17 18 19 Center UCL LCL Percent defective is = 6% Solve Using - MS- EXCEL- Question-3 Business Background: Question 3 - Continued from Question 3-20 points Company A makes two types of product, X and Y. The product tree (Bill of Materials) for Product X is shown below: The following is the 6 months forecast demand for X and Y P-X Product X A(2 B(5 C(3 Month Demand Product Y July 100 August 110 September 120 October 140 November 100 December 100 K(2 K(3 Month July August September October November December Demand 140 150 180 170 140 140 Company A uses P chart to track operation performance. The p chart of each products is shown below (p stands for the proportion of defects, this include both regular production and OT production). The defect product will be scrapped. C(2 D K(3 P Chart for X 0.0580 0.0560 Construct the ERP plan of July and August for Product X, use the best option from Question 3 with the following assumptions: 0.0540 0.0520 0.0500 0.0480 1. Assume there are 4 weeks for each month. 2. The lead time for each level is ONE week. 3. There is no inventory on hand. 4. Product X are needed in beginning of Week 4 and Week 8. 0.0460 0.0440 0.0420 Question 4-Continued from Question 4 -20 Points 1 2 3 4 5 6 7 8 9 10 11 12 13 14 15 16 17 18 19 -P-Center UCLLCL The purchasing information of parts K and D are listed below: Percent defective is = 5% Percent of good product is 95% Part Name Yearly Demand Ordering Cost Unit Cost Holding Cost K 46500 $150 per order $20 per unit $1.00 per unit per year D 3000 $200 per order $110 per unit $10 per unit per year Thus July will be 100+(100*0.05) = 105 P Chart for Y Find the economic order quantity for both and D 0.0720 0.0670 0.0620 0.0570 0.0520 5. Given: 20 points) Let USL = Upper Specification Limit, LSL = Lower Specification Limit, X = Process mean, o = Process standard deviation. USL = 30 minutes, LSL = 45 minutes, Armand = 38 minutes, Armand = 3.0 minutes X Jerry = 37 minutes, Jerry = 2.5 minutes X Melisse = 37.5 minutes, Melissa = 1.8 minutes a. Determine capability (Cp and Cpk) of each participant and find out if they are capable 1 2 3 4 5 6 7 8 9 10 11 12 13 14 15 16 17 18 19 Center UCL LCL Percent defective is = 6% Solve Using - MS- EXCEL- Question-3


