

Question: . . . Business development team has requested engineering department to prepare a hydraulic, mechanical design plus few inputs for the economic design. The project
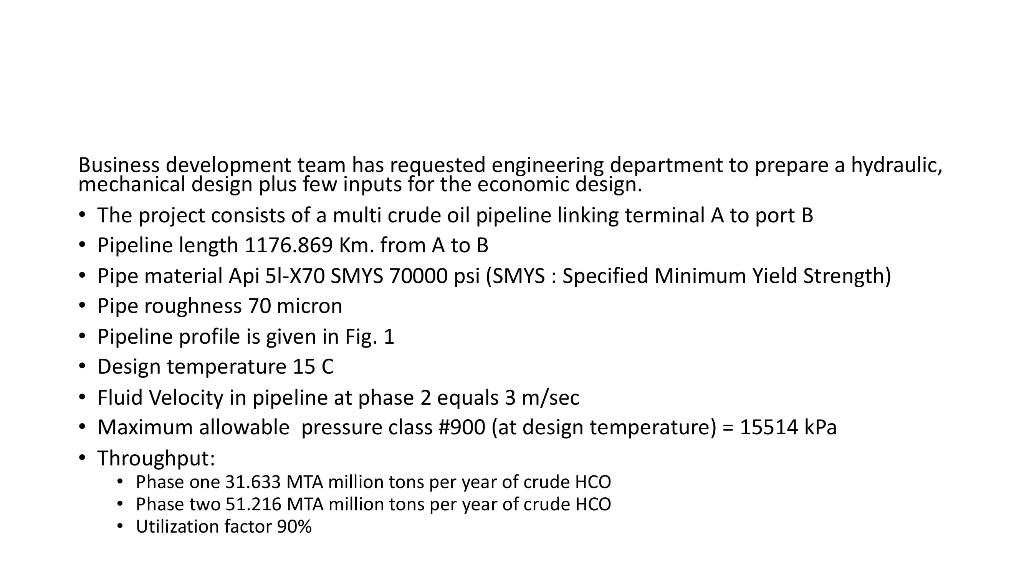
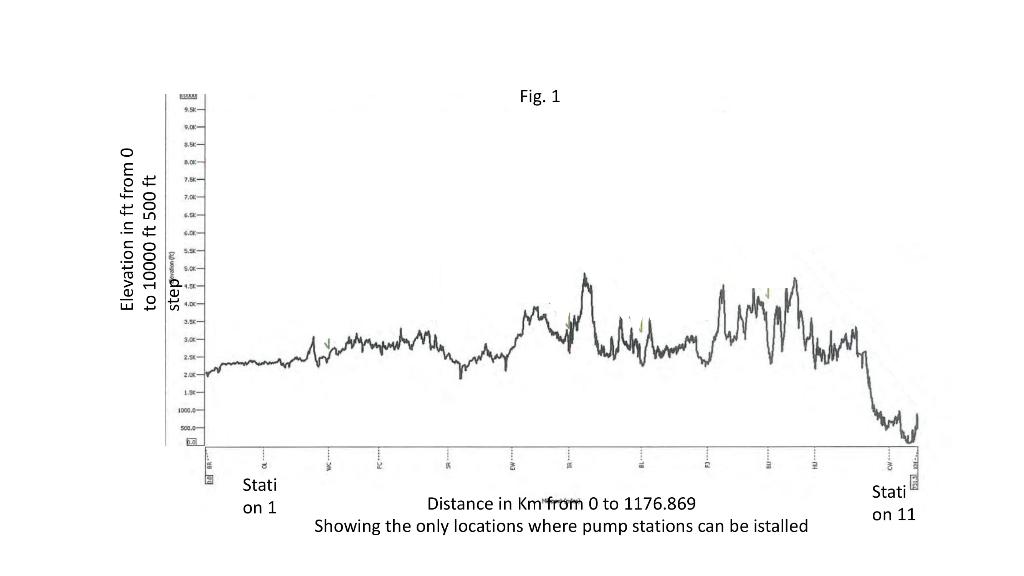
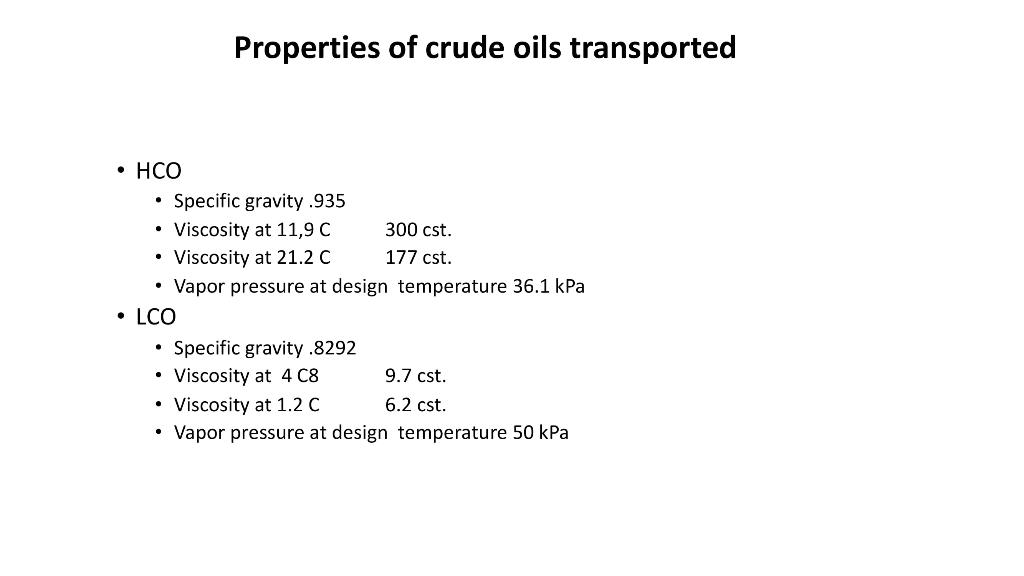
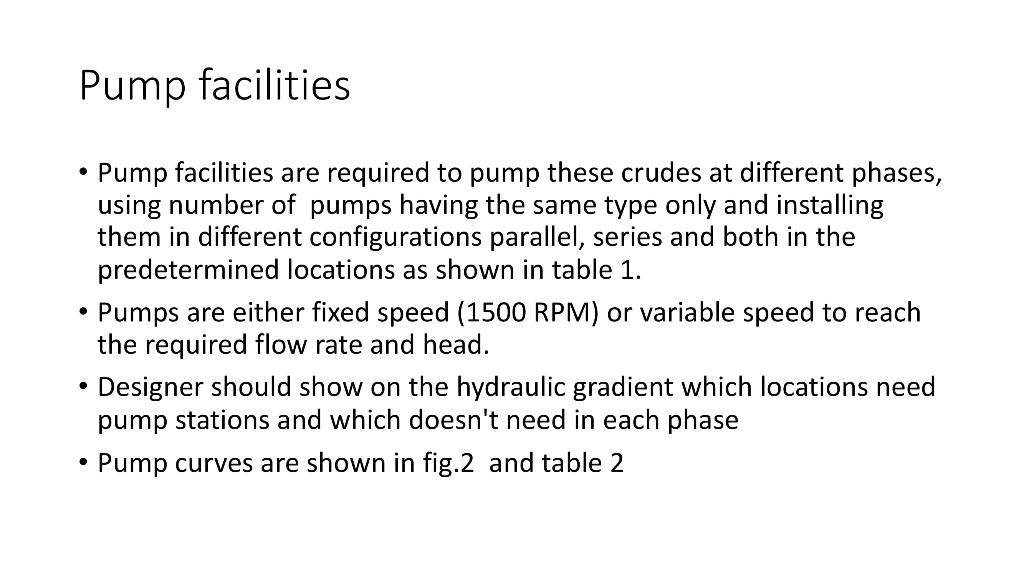
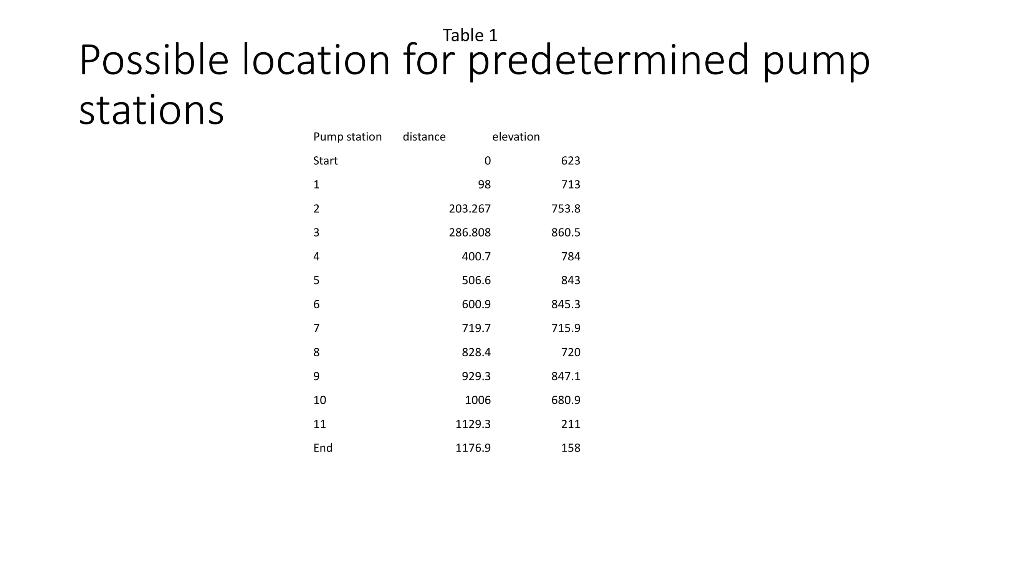
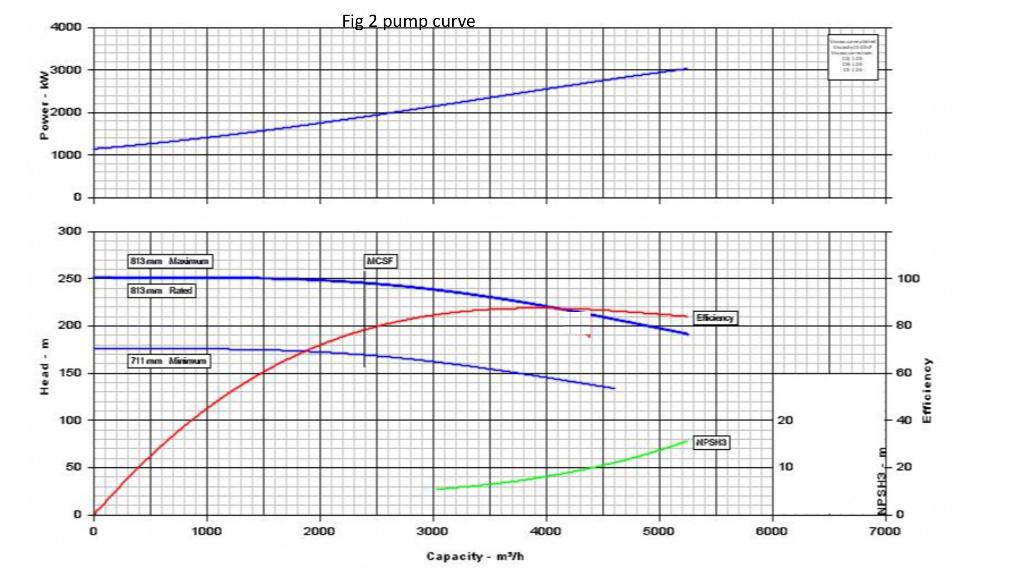
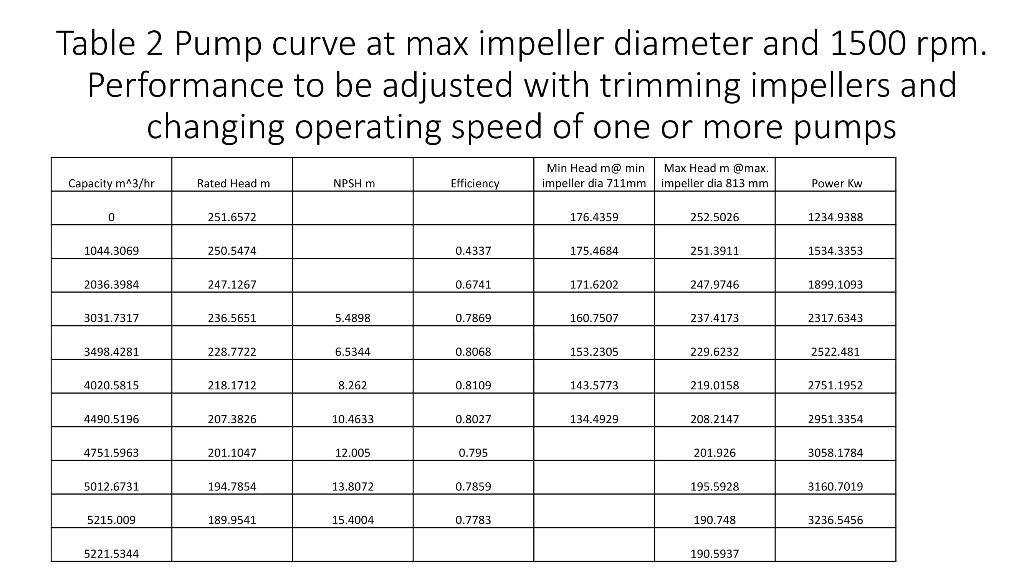
. . . Business development team has requested engineering department to prepare a hydraulic, mechanical design plus few inputs for the economic design. The project consists of a multi crude oil pipeline linking terminal A to port B Pipeline length 1176.869 Km. from A to B Pipe material Api 51-X70 SMYS 70000 psi (SMYS : Specified Minimum Yield Strength) Pipe roughness 70 micron Pipeline profile is given in Fig. 1 Design temperature 15 C Fluid Velocity in pipeline at phase 2 equals 3 m/sec Maximum allowable pressure class #900 (at design temperature) = 15514 kPa Throughput: Phase one 31.633 MTA million tons per year of crude HCO Phase two 51.216 MTA million tons per year of crude HCO Utilization factor 90% . Fig. 1 - No 2,5 7. Elevation in ft from 0 to 10000 ft 500 ft SE 4- 3.- Ali bin 2 1000,- 500.0 Stati on 1 Distance in Km from 0 to 1176.869 Showing the only locations where pump stations can be istalled Stati on 11 Properties of crude oils transported . . . Specific gravity.935 Viscosity at 11,9 C 300 cst. Viscosity at 21.2 C 177 cst. Vapor pressure at design temperature 36.1 kPa LCO Specific gravity .8292 Viscosity at 408 9.7 cst. Viscosity at 1.2 C 6.2 cst. Vapor pressure at design temperature 50 kPa . . . Pump facilities C Pump facilities are required to pump these crudes at different phases, using number of pumps having the same type only and installing them in different configurations parallel, series and both in the predetermined locations as shown in table 1. Pumps are either fixed speed (1500 RPM) or variable speed to reach the required flow rate and head. Designer should show on the hydraulic gradient which locations need pump stations and which doesn't need in each phase Pump curves are shown fig.2 and table . . Table 1 Possible location for predetermined pump stations Pump station distance elevation Start 0 623 1 98 713 2 203.267 753.8 3 286.808 860.5 4 4007 784 843 5 506.6 6 600.9 845.3 7 719.7 715.9 8 828.4 720 9 929.3 847.1 10 1006 680.9 11 1129.3 211 End 1176.9 158 4000 Fig 2 pump curve 3000 2000 1000 0 300 s13 MCSE 250 100 813mm Rated Exp 200 80 711 mm Mim Head .m 150 60 Efficiency 100 20 40 DPSH3 H- 50 10 20 w 0 0 7000 1000 2000 3000 4000 5000 BCCC Capacity - m/h Table 2 Pump curve at max impeller diameter and 1500 rpm. Performance to be adjusted with trimming impellers and changing operating speed of one or more pumps Capacity m^3/hr Min Head m@min Max Head m@max. impeller dia 711mm impeller dia 813 mm Rated Head m NPSH m Efficiency Power kw 0 251.6572 176.4359 252.5026 1234.9388 1044.3069 250.5474 0.4337 175.4684 251.3911 1534.3353 2036.3984 247.1267 0.6741 171.6202 247.9746 1899.1093 3031.7317 236.5651 5.4898 0.7869 160.7507 237.4173 2317.6343 3498.4281 228.7722 6.5344 0.8068 153.2305 229.6232 2522.481 4020.5815 218.1712 8.262 0.8109 143.5773 219.0158 2751.1952 4490.5196 207.3826 10.4633 0.8027 134.4929 208.2147 2951.3354 4751.5963 201.1047 12.005 0.795 201.926 3058.1784 5012.6731 194.7854 13.8072 0.7859 195.5928 3160.7019 5215.009 189.9541 15.4004 0.7783 190.748 3236.5456 5221.5344 190.5937 Question one diameter calculation Calculate the pipeline diameter based on phase 2 throughput at a fluid velocity of 3 m/sec. at the inlet of the pipeline (maximum allowable pressure) Question 2 phase one 1. Calculate the pressure loss along the pipeline 2. Draw the hydraulic gradient for phase one on top of the profile 3. Determine how many pump stations are required and their locations 4. Draw the system curve for each section between 2 pump stations 5. Draw Q/h pumps curve configuration (parallel/ series) at each section that fulfils the required flowrate and head intersection with the above pipeline system curve in point 4 above 6. Define the speed of each pump corresponding to the intersection point in point 5 7. Calculate the horse power required for phase one and hence the Kwhr per year
Step by Step Solution
There are 3 Steps involved in it

Get step-by-step solutions from verified subject matter experts