

Question: Business Statistics Bob wants to construct a linear regression model to examine whether there is any relationship between the income and race of working adults
Business Statistics
Bob wants to construct a linear regression model to examine whether there is any relationship between the income and race of working adults in Singapore. He records the race of a person as chinese, malay, indian or others. He uses data from a simple random sample of 30 working adults to building the following details model. Income ($ per month) is A + B x I Malay + C x I Indian + D x I others. Where A, B, C and D are the coefficients and I Malay is if person malay otherwise, I Indian is if person Indian otherwise, and I others is if person Others otherwise. He uses SPSS to evaluate the details model and estimate the coefficients using the data. The following is the output.
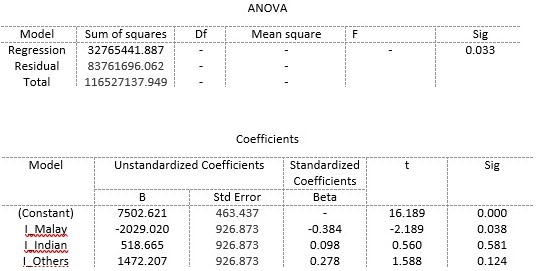
ANOVA Model Sum of squares Of Mean square F Sig Regression 32765441.887 0.033 Residual 83761696.062 Total 116527137.949 Coefficients Model Unstandardized Coefficients Standardized Sig Coefficients B Std Error Beta (Constant) 7502.621 463.437 16.189 0.000 I Malay -2029.020 926.873 -0.384 -2.189 0.038 I Indian 518.665 926.873 0.098 0.560 0.581 !_Others 1472.207 926.873 0.278 1.588 0.124
Step by Step Solution
There are 3 Steps involved in it

Get step-by-step solutions from verified subject matter experts