

Question: I need the R codes as well. Does pollution have effect on mortality? Data in one early study designed to explore this issue came 'om
I need the R codes as well.
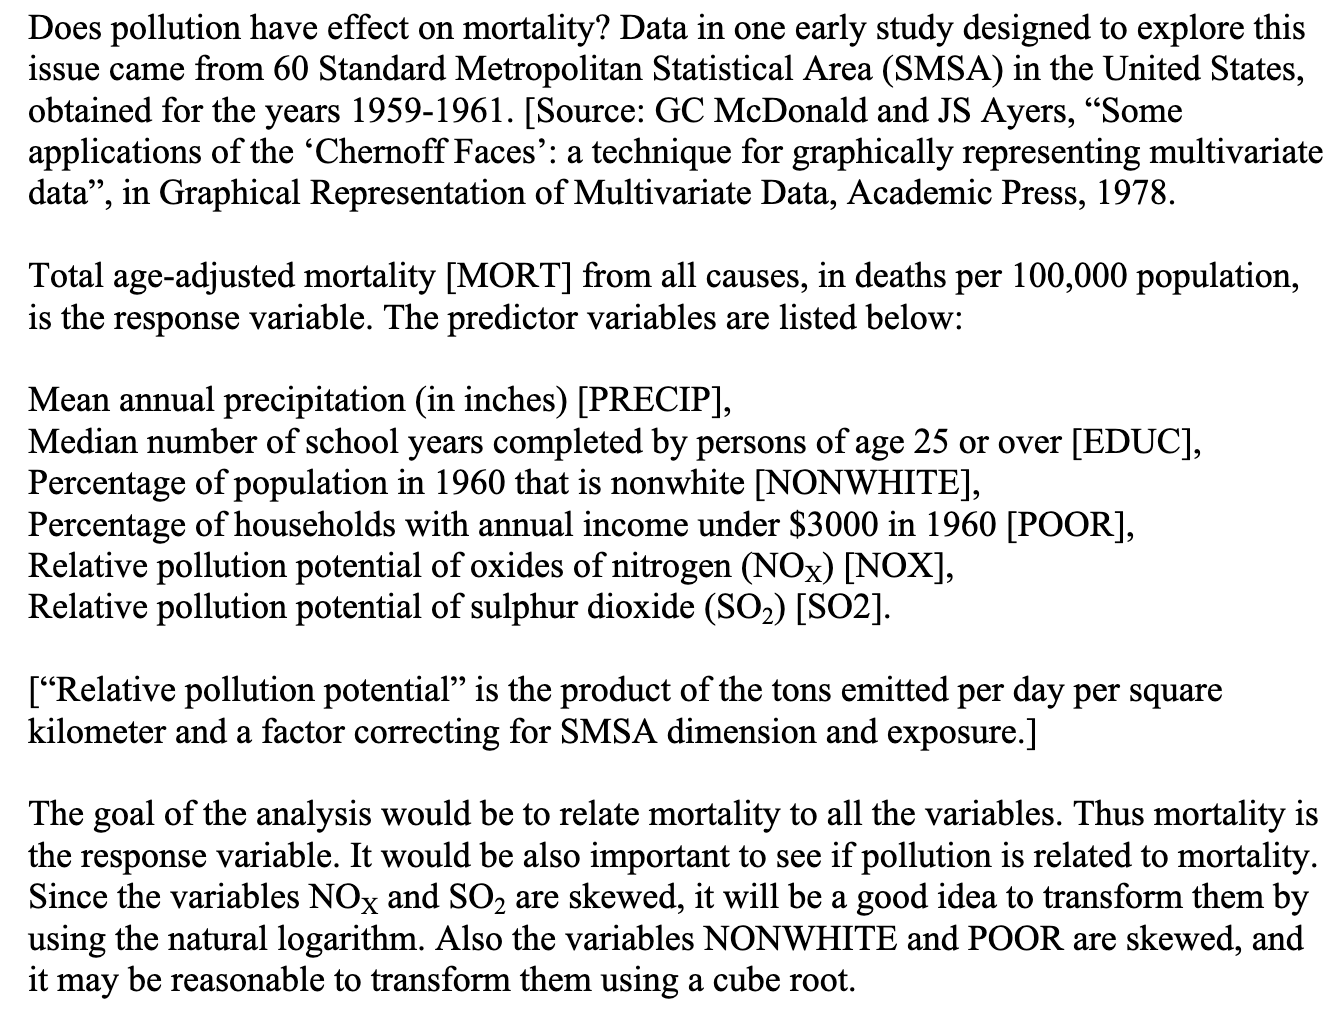
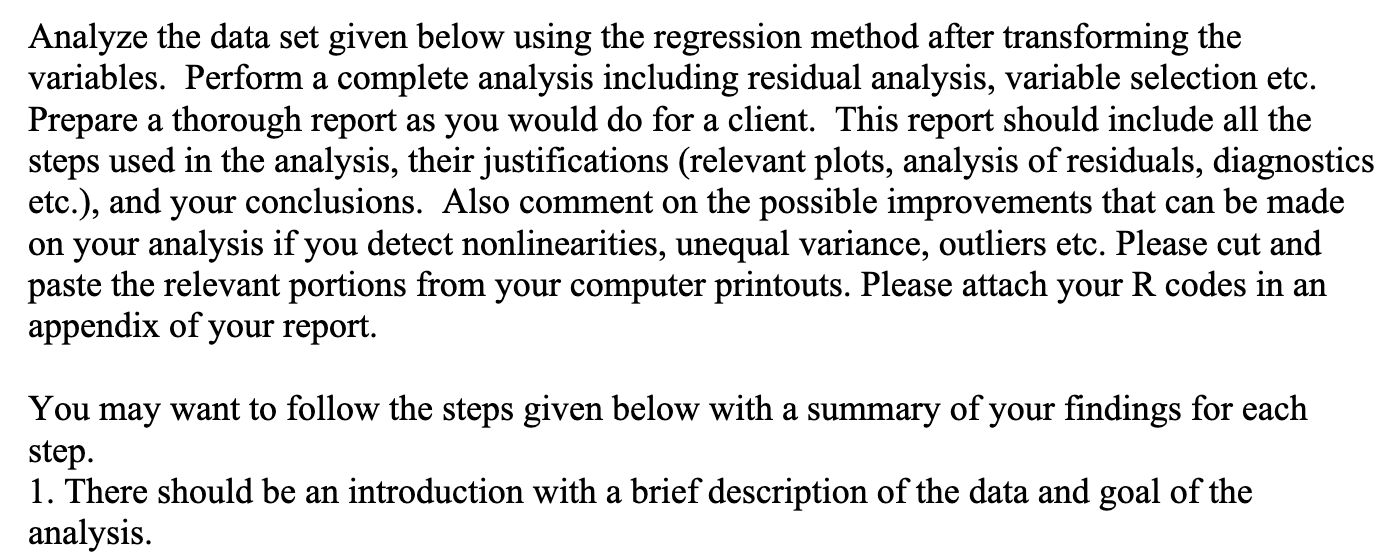
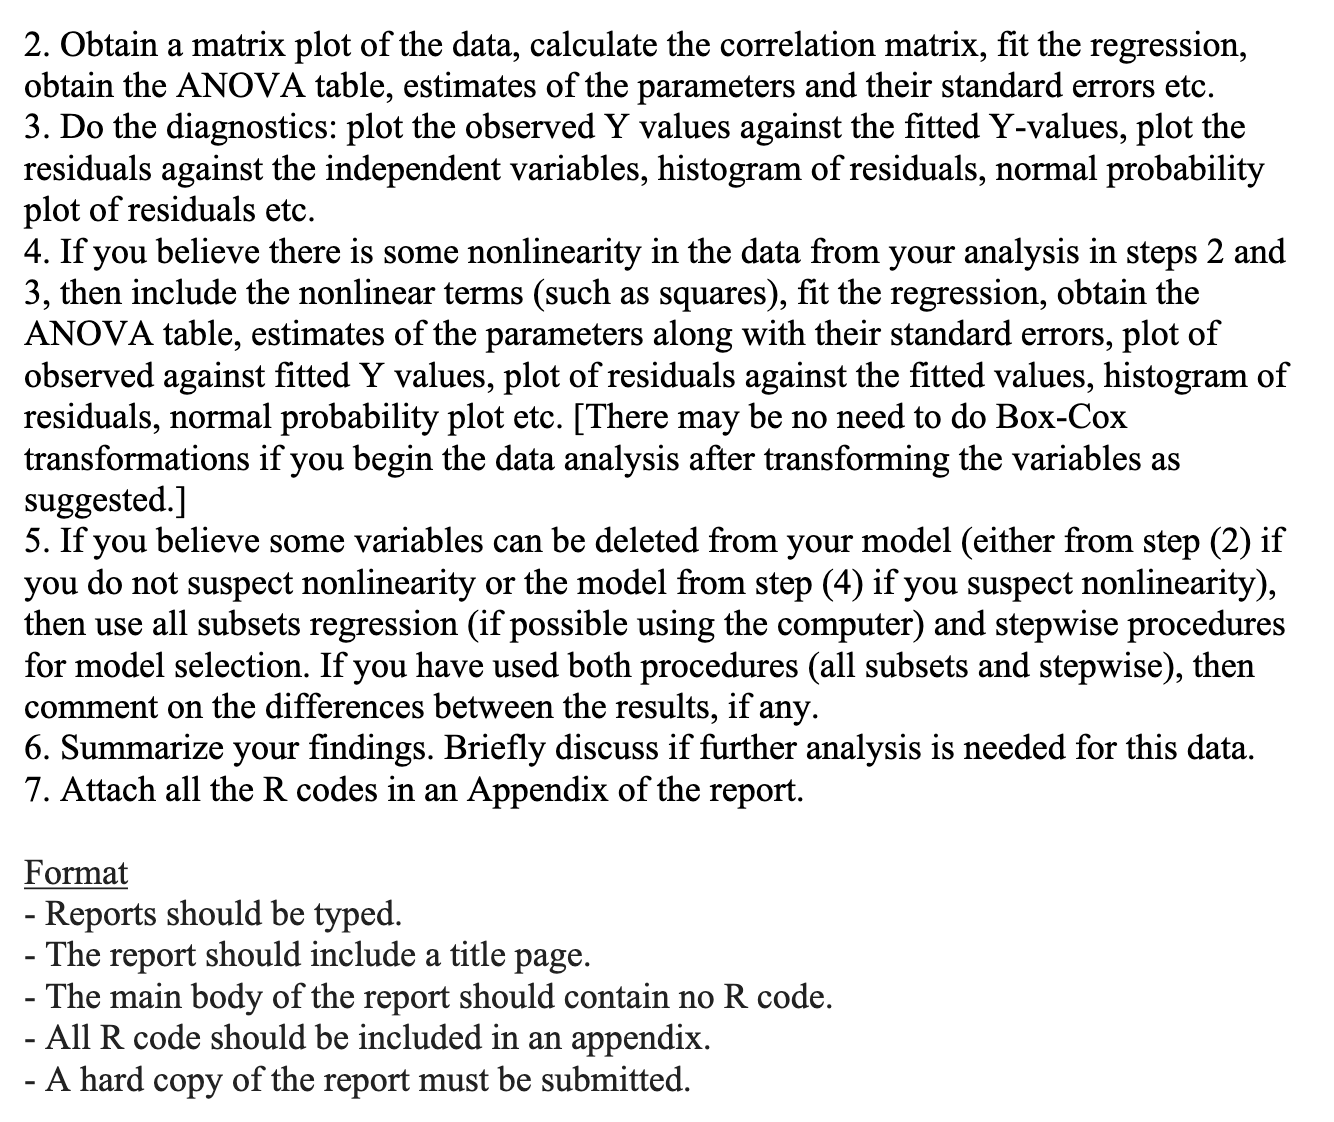
Does pollution have effect on mortality? Data in one early study designed to explore this issue came 'om 60 Standard Metropolitan Statistical Area (SMSA) in the United States, obtained for the years 1959-1961. [Source: GC McDonald and J S Ayers, \"Some applications of the 'Chemoff Faces': a technique for graphically representing multivariate data\Analyze the data set given below using the regression method after transforming the variables. Perform a complete analysis including residual analysis, variable selection etc. Prepare a thorough report as you would do for a client. This report should include all the steps used in the analysis, their justications (relevant plots, analysis of residuals, diagnostics etc.), and your conclusions. Also comment on the possible improvements that can be made on your analysis if you detect nonlinearities, unequal variance, outliers etc. Please cut and paste the relevant portions from your computer printouts. Please attach your R codes in an appendix of your report. You may want to follow the steps given below with a summary of your ndings for each step. 1. There should be an introduction with a brief description of the data and goal of the analysis. 2. Obtain a matrix plot of the data, calculate the correlation matrix, t the regression, obtain the AN OVA table, estimates of the parameters and their standard errors etc. 3. Do the diagnostics: plot the observed Y values against the tted Y-values, plot the residuals against the independent variables, histogram of residuals, normal probability plot of residuals etc. 4. If you believe there is some nonlinearity in the data from your analysis in steps 2 and 3, then include the nonlinear terms (such as squares), t the regression, obtain the ANOVA table, estimates of the parameters along with their standard errors, plot of observed against fitted Y values, plot of residuals against the tted values, histogram of residuals, normal probability plot etc. [There may be no need to do Box-Cox transformations if you begin the data analysis after transforming the variables as suggested] 5. If you believe some variables can be deleted from your model (either from step (2) if you do not suspect nonlinearity or the model om step (4) if you suspect nonlinearity), then use all subsets regression (if possible using the computer) and stepwise procedures for model selection. If you have used both procedures (all subsets and stepwise), then comment on the differences between the results, if any. 6. Summarize your findings. Briey discuss if further analysis is needed for this data. 7. Attach all the R codes in an Appendix of the report. Format - Reports should be typed. - The report should include a title page. - The main body of the report should contain no R code. - All R code should be included in an appendix. - A hard copy of the report must be submitted
Step by Step Solution
There are 3 Steps involved in it

Get step-by-step solutions from verified subject matter experts