

Question: business_performance.dat is not needed for bash code A company wants to prepare a profit/loss report in a tabular form. The company has 4 different business
business_performance.dat is not needed for bash code
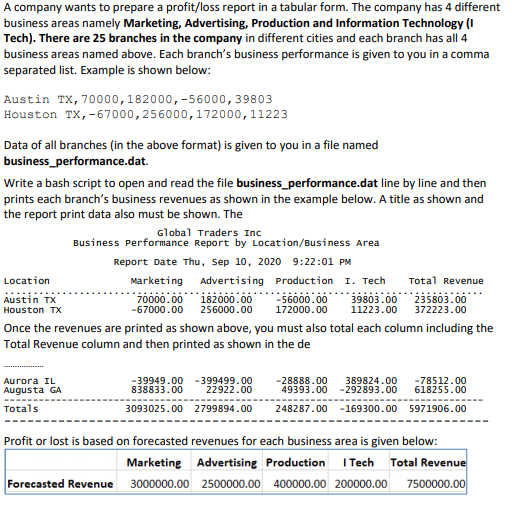
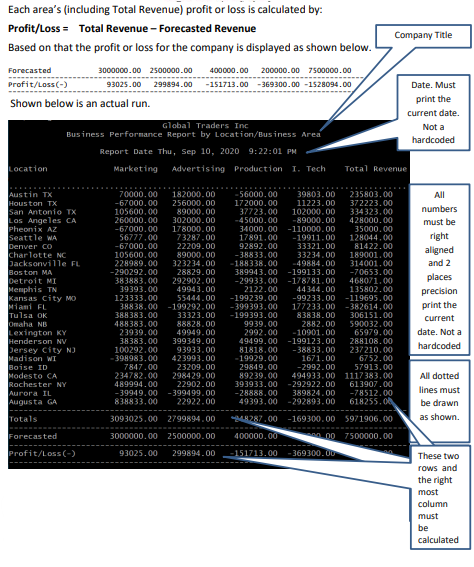
A company wants to prepare a profit/loss report in a tabular form. The company has 4 different business areas namely Marketing, Advertising, Production and Information Technology (I Tech). There are 25 branches in the company in different cities and each branch has all 4 business areas named above. Each branch's business performance is given to you in a comma separated list. Example is shown below: Austin TX, 70000,182000,-56000, 39803 Houston TX,-67000, 256000, 172000, 11223 Data of all branches in the above format) is given to you in a file named business_performance.dat. Write a bash script to open and read the file business_performance.dat line by line and then prints each branch's business revenues as shown in the example below. A title as shown and the report print data also must be shown. The Global Traders Inc Business Performance Report by Location/Business Area Report Date Thu, Sep 10, 2020 9:22:01 PM Location Marketing Advertising Production I. Tech Austin TX 70000.00 182000.00 -56000.00 39803.00 235803.00 Houston TX -67000.00 256000.00 172000.00 11223.00 372223.00 Once the revenues are printed as shown above, you must also total each column including the Total Revenue column and then printed as shown in the de Total Revenue -39949.00 -399499.00 838833.00 22922.00 389824.00 -292893.00 Aurora IL Augusta GA Totals -28888.00 49393.00 248287.00 -78512.00 618255.00 3093025.00 2799894.00 - 169300.00 5971906.00 Profit or lost is based on forecasted revenues for each business area is given below: Marketing Advertising Production I Tech Total Revenue Forecasted Revenue 3000000.00 2500000.00 400000.00 200000.00 7500000.00 Company Title Each area's (including Total Revenue) profit or loss is calculated by: Profit/Loss = Total Revenue - Forecasted Revenue Based on that the profit or loss for the company is displayed as shown below. Forecasted 3000000.00 2500000.00 400000.00 200000.00 7500000.00 Profit/Loss(-) 93025.00 299894.00 -151713.00 -369300.00 -1528094.00 Shown below is an actual run. Date. Must print the current date. Not a hardcoded Global Traders Inc Business Performance Report by Location/Business Area Report Date Thu, Sep 10, 2020 9:22:01 PM Marketing Advertising Production 1. Tech Location Total Revenue Austin TX Houston TX San Antonio TX Los Angeles CA Pheonix AZ Seattle WA Denver CO Charlotte NC Jacksonville FL Boston MA Detroit MI Memphis TN Kansas City MO Mian FL Tulsa OK Omaha NBS Lexington KY Henderson NV Jersey City N) Madison WT Boise ID Modesto CA Rochester NY Aurora IL Augusta GA 70000.00 182000.00 -67000.00 256000.00 105600.00 89000.00 260000.00 302000.00 -67000.00 178000.00 56777.00 73287.00 -67000.00 22209.00 105600.00 89000.00 228989.00 323234.00 -290292.00 28829.00 383883.00 292902.00 39393.00 49943.00 123333.00 55444.00 38838.00 -199292.00 388383.00 33323.00 488383.00 88828.00 23939.00 49949.00 38383.00 399349.00 100292.00 93933.00 -398983.00 423993.00 7847.00 23209.00 234782.00 298429.00 489994.00 22902.00 -39949.00 -399499.00 838833.00 22922.00 -56000.00 172000.00 37723.00 -45000.00 34000.00 17891.00 92892.00 -38833.00 -188338.00 389943.00 -29933.00 2122.00 -199239.00 -399393.00 -199393.00 9939.00 2992.00 49499.00 81818.00 -19929.00 29849.00 89239.00 393933.00 -28888.00 49393.00 39803.00 11223.00 102000.00 -89000.00 -110000.00 -19911.00 33321.00 33234.00 -49884.00 -199133.00 -178781.00 44344.00 -99233.00 177233.00 83838.00 2882.00 -10901.00 -199123.00 -38833.00 1671.00 -2992.00 494933.00 -292922.00 389824.00 - 292893.00 235803.00 372223.00 334323.00 428000.00 35000.00 128044.00 81422.00 189001.00 314001.00 -70653.00 468071.00 135802.00 -119695.00 -382614.00 306151.00 590032.00 65979.00 288108.00 237210.00 6752.00 57913.00 1117383.00 613907.00 -78512.00 618255.00 All numbers must be right aligned and 2 places precision print the current date. Not a hardcoded All dotted lines must be drawn as shown. Totals 3093025.00 2799894.00 249287.00 Forecasted 3000000.00 2500000.00 400000.00 -169300.00 5971906.00 0.00 7500000.00 369300.00 Profit/Loss(-) 93025.00 299894.00 -151713.00 These two rows and the right most column must be calculated A company wants to prepare a profit/loss report in a tabular form. The company has 4 different business areas namely Marketing, Advertising, Production and Information Technology (I Tech). There are 25 branches in the company in different cities and each branch has all 4 business areas named above. Each branch's business performance is given to you in a comma separated list. Example is shown below: Austin TX, 70000,182000,-56000, 39803 Houston TX,-67000, 256000, 172000, 11223 Data of all branches in the above format) is given to you in a file named business_performance.dat. Write a bash script to open and read the file business_performance.dat line by line and then prints each branch's business revenues as shown in the example below. A title as shown and the report print data also must be shown. The Global Traders Inc Business Performance Report by Location/Business Area Report Date Thu, Sep 10, 2020 9:22:01 PM Location Marketing Advertising Production I. Tech Austin TX 70000.00 182000.00 -56000.00 39803.00 235803.00 Houston TX -67000.00 256000.00 172000.00 11223.00 372223.00 Once the revenues are printed as shown above, you must also total each column including the Total Revenue column and then printed as shown in the de Total Revenue -39949.00 -399499.00 838833.00 22922.00 389824.00 -292893.00 Aurora IL Augusta GA Totals -28888.00 49393.00 248287.00 -78512.00 618255.00 3093025.00 2799894.00 - 169300.00 5971906.00 Profit or lost is based on forecasted revenues for each business area is given below: Marketing Advertising Production I Tech Total Revenue Forecasted Revenue 3000000.00 2500000.00 400000.00 200000.00 7500000.00 Company Title Each area's (including Total Revenue) profit or loss is calculated by: Profit/Loss = Total Revenue - Forecasted Revenue Based on that the profit or loss for the company is displayed as shown below. Forecasted 3000000.00 2500000.00 400000.00 200000.00 7500000.00 Profit/Loss(-) 93025.00 299894.00 -151713.00 -369300.00 -1528094.00 Shown below is an actual run. Date. Must print the current date. Not a hardcoded Global Traders Inc Business Performance Report by Location/Business Area Report Date Thu, Sep 10, 2020 9:22:01 PM Marketing Advertising Production 1. Tech Location Total Revenue Austin TX Houston TX San Antonio TX Los Angeles CA Pheonix AZ Seattle WA Denver CO Charlotte NC Jacksonville FL Boston MA Detroit MI Memphis TN Kansas City MO Mian FL Tulsa OK Omaha NBS Lexington KY Henderson NV Jersey City N) Madison WT Boise ID Modesto CA Rochester NY Aurora IL Augusta GA 70000.00 182000.00 -67000.00 256000.00 105600.00 89000.00 260000.00 302000.00 -67000.00 178000.00 56777.00 73287.00 -67000.00 22209.00 105600.00 89000.00 228989.00 323234.00 -290292.00 28829.00 383883.00 292902.00 39393.00 49943.00 123333.00 55444.00 38838.00 -199292.00 388383.00 33323.00 488383.00 88828.00 23939.00 49949.00 38383.00 399349.00 100292.00 93933.00 -398983.00 423993.00 7847.00 23209.00 234782.00 298429.00 489994.00 22902.00 -39949.00 -399499.00 838833.00 22922.00 -56000.00 172000.00 37723.00 -45000.00 34000.00 17891.00 92892.00 -38833.00 -188338.00 389943.00 -29933.00 2122.00 -199239.00 -399393.00 -199393.00 9939.00 2992.00 49499.00 81818.00 -19929.00 29849.00 89239.00 393933.00 -28888.00 49393.00 39803.00 11223.00 102000.00 -89000.00 -110000.00 -19911.00 33321.00 33234.00 -49884.00 -199133.00 -178781.00 44344.00 -99233.00 177233.00 83838.00 2882.00 -10901.00 -199123.00 -38833.00 1671.00 -2992.00 494933.00 -292922.00 389824.00 - 292893.00 235803.00 372223.00 334323.00 428000.00 35000.00 128044.00 81422.00 189001.00 314001.00 -70653.00 468071.00 135802.00 -119695.00 -382614.00 306151.00 590032.00 65979.00 288108.00 237210.00 6752.00 57913.00 1117383.00 613907.00 -78512.00 618255.00 All numbers must be right aligned and 2 places precision print the current date. Not a hardcoded All dotted lines must be drawn as shown. Totals 3093025.00 2799894.00 249287.00 Forecasted 3000000.00 2500000.00 400000.00 -169300.00 5971906.00 0.00 7500000.00 369300.00 Profit/Loss(-) 93025.00 299894.00 -151713.00 These two rows and the right most column must be calculated
Step by Step Solution
There are 3 Steps involved in it

Get step-by-step solutions from verified subject matter experts