

Question: I need help in finding the sum for totals, forecasted and profit/loss (-) for each row and column. A company wants to prepare a profit/loss
I need help in finding the sum for "totals, forecasted and profit/loss (-)" for each row and column.
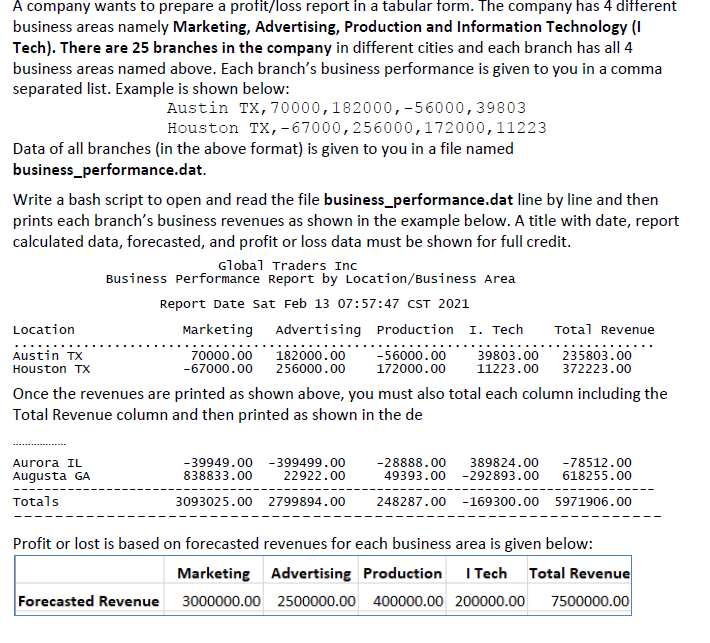
A company wants to prepare a profit/loss report in a tabular form. The company has 4 different business areas namely Marketing, Advertising, Production and Information Technology (I Tech). There are 25 branches in the company in different cities and each branch has all 4 business areas named above. Each branch's business performance is given to you in a comma separated list. Example is shown below: Austin TX, 70000, 182000,-56000,39803 Houston TX, -67000, 256000,172000, 11223 Data of all branches in the above format) is given to you in a file named business_performance.dat. Write a bash script to open and read the file business_performance.dat line by line and then prints each branch's business revenues as shown in the example below. A title with date, report calculated data, forecasted, and profit or loss data must be shown for full credit. Global Traders Inc Business Performance Report by Location/Business Area Report Date Sat Feb 13 07:57:47 CST 2021 Location Marketing Advertising Production I. Tech Total Revenue Austin TX 70000.00 182000.00 -56000.00 39803.00 235803.00 Houston TX -67000.00 256000.00 172000.00 11223.00 372223.00 Once the revenues are printed as shown above, you must also total each column including the Total Revenue column and then printed as shown in the de -28888.00 49393.00 Aurora IL Augusta GA Totals -39949.00 838833.00 3093025.00 -399499.00 22922.00 2799894.00 389824.00 -78512.00 -292893.00 618255.00 - 169300.00 5971906.00 248287.00 Profit or lost is based on forecasted revenues for each business area is given below: Marketing Advertising Production I Tech Total Revenue Forecasted Revenue 3000000.00 2500000.00 400000.00 200000.00 7500000.00 A company wants to prepare a profit/loss report in a tabular form. The company has 4 different business areas namely Marketing, Advertising, Production and Information Technology (I Tech). There are 25 branches in the company in different cities and each branch has all 4 business areas named above. Each branch's business performance is given to you in a comma separated list. Example is shown below: Austin TX, 70000, 182000,-56000,39803 Houston TX, -67000, 256000,172000, 11223 Data of all branches in the above format) is given to you in a file named business_performance.dat. Write a bash script to open and read the file business_performance.dat line by line and then prints each branch's business revenues as shown in the example below. A title with date, report calculated data, forecasted, and profit or loss data must be shown for full credit. Global Traders Inc Business Performance Report by Location/Business Area Report Date Sat Feb 13 07:57:47 CST 2021 Location Marketing Advertising Production I. Tech Total Revenue Austin TX 70000.00 182000.00 -56000.00 39803.00 235803.00 Houston TX -67000.00 256000.00 172000.00 11223.00 372223.00 Once the revenues are printed as shown above, you must also total each column including the Total Revenue column and then printed as shown in the de -28888.00 49393.00 Aurora IL Augusta GA Totals -39949.00 838833.00 3093025.00 -399499.00 22922.00 2799894.00 389824.00 -78512.00 -292893.00 618255.00 - 169300.00 5971906.00 248287.00 Profit or lost is based on forecasted revenues for each business area is given below: Marketing Advertising Production I Tech Total Revenue Forecasted Revenue 3000000.00 2500000.00 400000.00 200000.00 7500000.00
Step by Step Solution
There are 3 Steps involved in it

Get step-by-step solutions from verified subject matter experts