

Question: By a graphical integration, compute the stock inventory and explain calculations for the following time points: t=2.5 t=7.5 t=15 Inventory X Production Shipments The figure
By a graphical integration, compute the stock inventory and explain calculations for the following time points: t=2.5 t=7.5 t=15
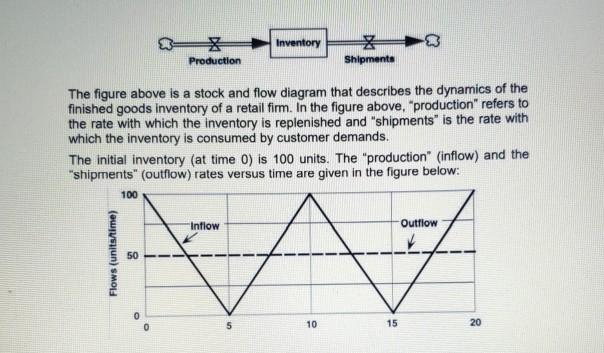
Inventory X Production Shipments The figure above is a stock and flow diagram that describes the dynamics of the finished goods inventory of a retail firm. In the figure above,"production" refers to the rate with which the inventory is replenished and "shipments" is the rate with which the inventory is consumed by customer demands. The initial inventory (at time 0) is 100 units. The "production" (inflow) and the "shipments" (outflow) rates versus time are given in the figure below: 100 Inflow Outflow Flows (units/time) 0 0 5 10 15 20Step by Step Solution
There are 3 Steps involved in it
1 Expert Approved Answer
Step: 1 Unlock

Question Has Been Solved by an Expert!
Get step-by-step solutions from verified subject matter experts
Step: 2 Unlock
Step: 3 Unlock