

Question: by hand please 2. Based on observing a histogram perhaps we decided to create the following pixel intensity mappings in order to stretch the values
by hand please 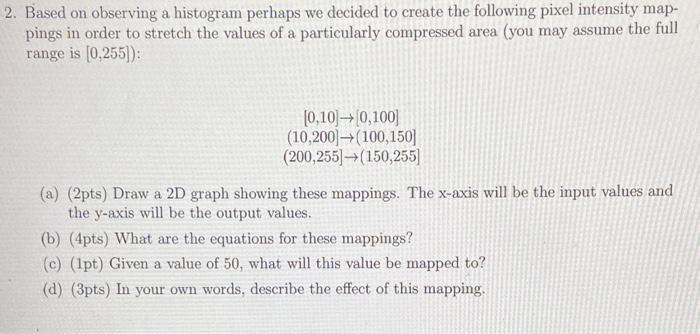
2. Based on observing a histogram perhaps we decided to create the following pixel intensity mappings in order to stretch the values of a particularly compressed area (you may assume the full range is [0,255]) : [0,10][0,100](10,200](100,150](200,255](150,255] (a) (2pts) Draw a 2D graph showing these mappings. The x-axis will be the input values and the y-axis will be the output values. (b) (4pts) What are the equations for these mappings? (c) (1pt) Given a value of 50 , what will this value be mapped to? (d) (3pts) In your own words, describe the effect of this mapping
Step by Step Solution
There are 3 Steps involved in it
1 Expert Approved Answer
Step: 1 Unlock

Question Has Been Solved by an Expert!
Get step-by-step solutions from verified subject matter experts
Step: 2 Unlock
Step: 3 Unlock