

Question: By looking at this contingency table, which cell's observed values had the largest difference from what was expected? Predictors Residual High School Bachelors Masters PhD
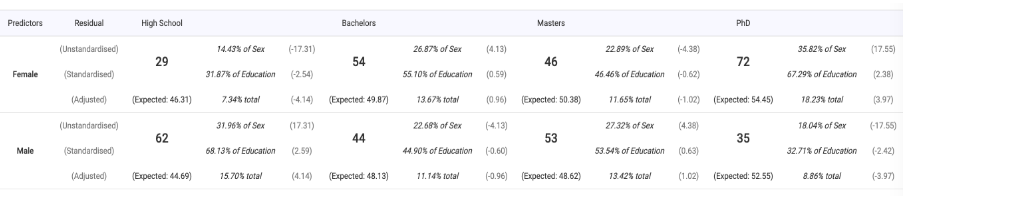
By looking at this contingency table, which cell's observed values had the largest difference from what was expected?

Predictors Residual High School Bachelors Masters PhD (Unstandardised) 14.43% of Sex (-17.31) 26.87% of Sex (4.13) 22 89% of Sex (-4.38) 35.82% of Sex (17.55) 29 54 46 72 Female (Standardised) 31 87% of Education (-2.54) 55 10% of Education (0.59) 46.46% of Education (-0.62) 67.29% of Education (2.38) (Adjusted) (Expected: 45.31) 7.34% total (-4.14) (Expected 49,87) 13.67% total (0.96) [Expected: 50.38) 71 65% total (-1.02) (Expected: 54.45) 18 23% total [3.97) (Unstandardized) 31.96% of Sex (17.31) 22.68% of Sex (-4.13) 27 32% of Sex (4.38) 18 04% of Sex (-17.55) 62 44 53 35 Male (Standardised) 68.73% of Education (2.59) 44.90% of Education (-0.60) 53.54% of Education (0.63) 32.71% of Education (-2.42) (Adjusted) (Expected: 44.69) 15. 70% total (4.14) (Expected: 48.13) 71. 14% total (-0.96) (Expected: 48.62) 13:42% total (1.02) (Expected: 52.55) 8.86% total (-3.97)
Step by Step Solution
There are 3 Steps involved in it

Get step-by-step solutions from verified subject matter experts