

Question: By only looking at these graphs. what specific frequencies/ frequency ranges does noise appear in? Figure 1 File Edit View Insert Tools Desktop Window Help
By only looking at these graphs. what specific frequencies/ frequency ranges does noise appear in?
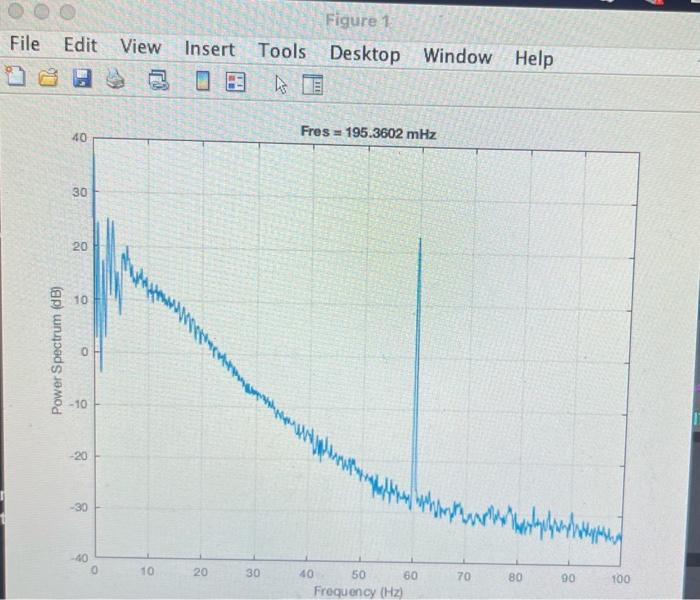
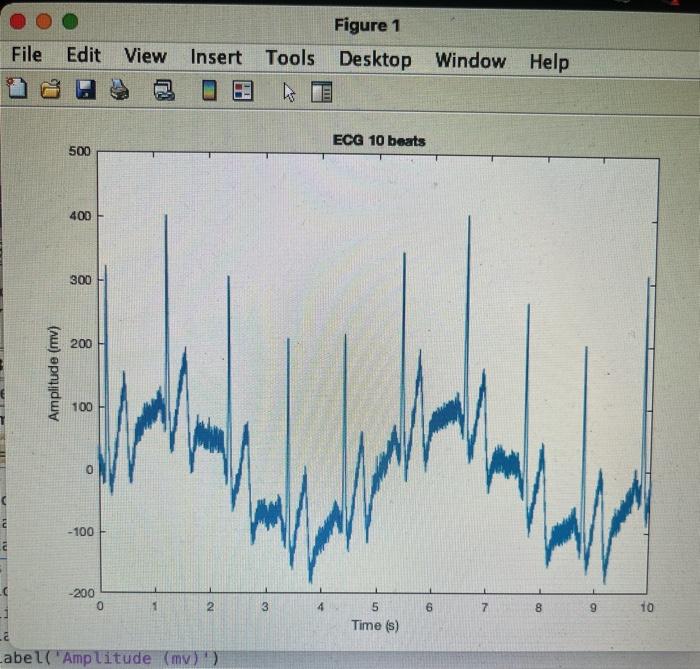
Figure 1 File Edit View Insert Tools Desktop Window Help Figure 1 File Edit View Insert Tools Desktop Window Help
Step by Step Solution
There are 3 Steps involved in it
1 Expert Approved Answer
Step: 1 Unlock

Question Has Been Solved by an Expert!
Get step-by-step solutions from verified subject matter experts
Step: 2 Unlock
Step: 3 Unlock