

Question: What conclusions can we draw from the plots (especially efficiency frontier, I'm having difficulty interpreting it)? Which strategies over-perform or under perform the market? Figure
What conclusions can we draw from the plots (especially efficiency frontier, I'm having difficulty interpreting it)? Which strategies over-perform or under perform the market?
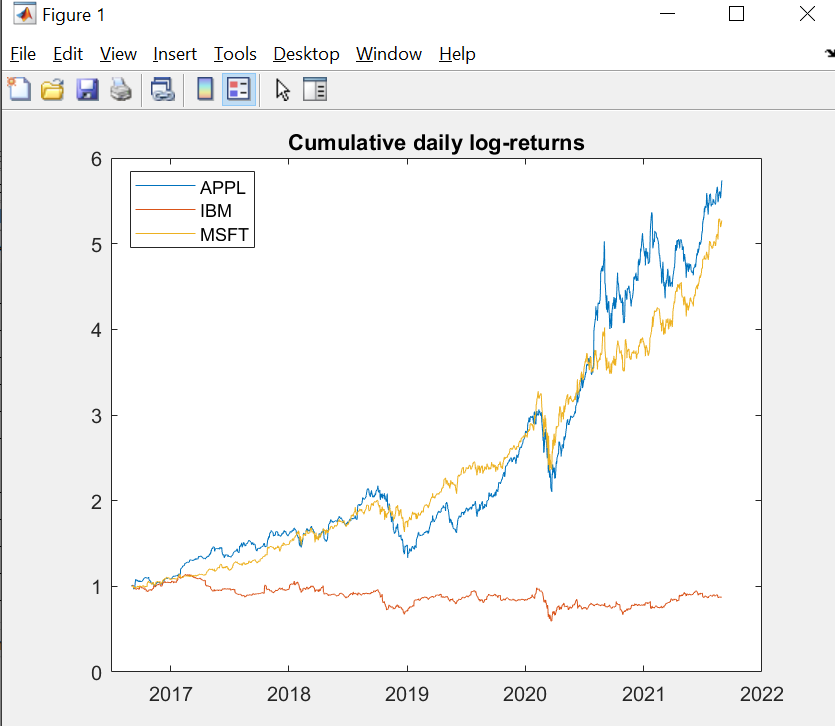
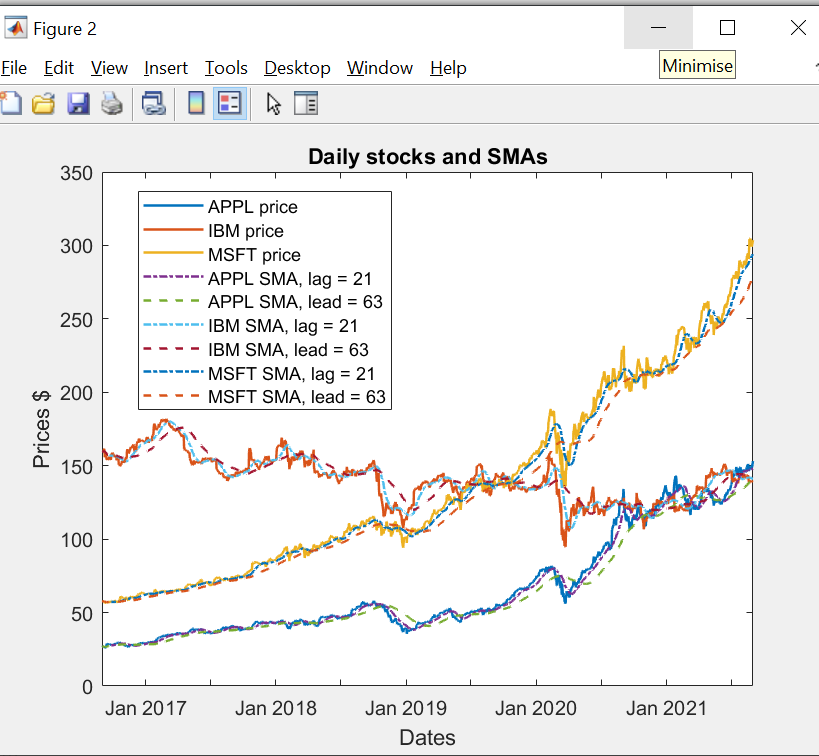
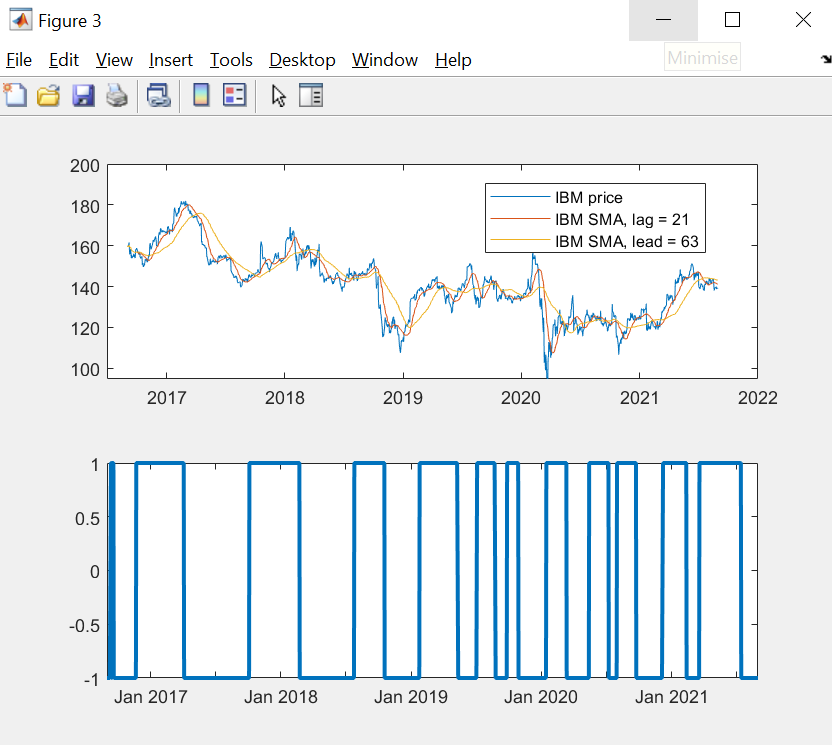
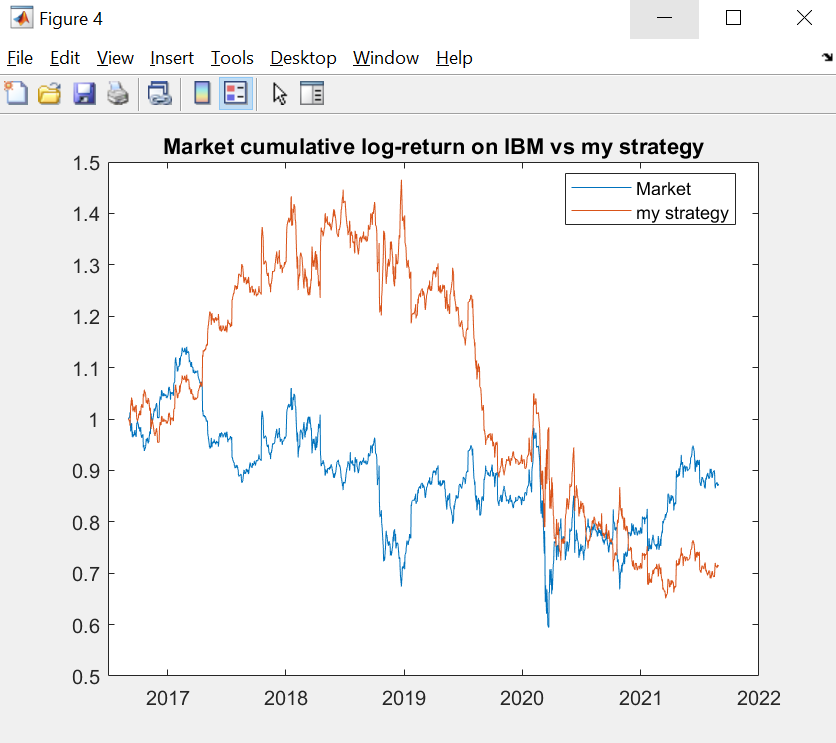
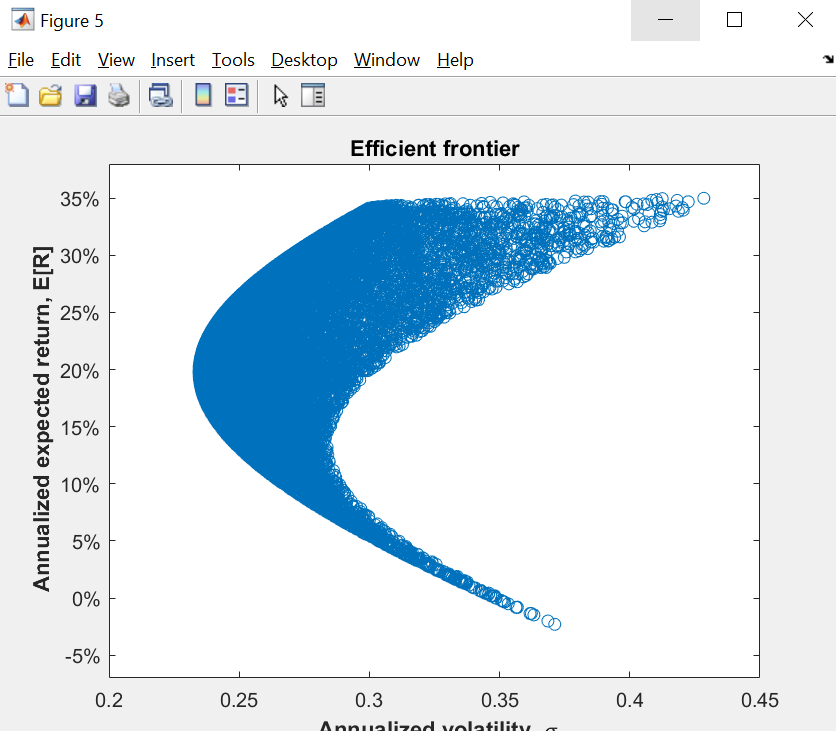
Figure 1 U File Edit View Insert Tools Desktop Window Help Cumulative daily log-returns 6 APPL IBM MSFT How 5 4 Warna 3 ya N may not 1 0 2017 2018 2019 2020 2021 2022 Figure 2 File Edit View Insert Tools Desktop Window Help Minimise Daily stocks and SMAS 350 300 APPL price IBM price MSFT price * APPL SMA, lag = 21 APPL SMA, lead = 63 IBM SMA, lag = 21 IBM SMA, lead = 63 MSFT SMA, lag = 21 MSFT SMA, lead = 63 250 200 Prices $ 150 100 50 0 Jan 2017 Jan 2018 Jan 2020 Jan 2021 Jan 2019 Dates Figure 3 X File Edit View Insert Tools Desktop Window Help Minimise 200 180 IBM price IBM SMA, lag = 21 IBM SMA, lead = 63 160 hassan 140 120 100 2017 2018 2019 2020 2021 2022 0.5 0 -0.5 -1 Jan 2017 Jan 2018 Jan 2019 Jan 2020 Jan 2021 Figure 4 U File Edit View Insert Tools Desktop Window Help Market cumulative log-return on IBM vs my strategy 1.5 Market my strategy 1.4 W 1.3 1.2 1.1 1 Cherry 0.9 Eure ay thing ihon 0.8 0.7 0.6 0.5 2017 2018 2019 2020 2021 2022 Figure 5 - U File Edit View Insert Tools Desktop Window Help Efficient frontier 35% 30% 25% 20% Annualized expected return, E[R] 15% 10% 5% 1 0% -5% 0.2 0.25 0.4 0.45 0.3 0.35 Annualized volatility Figure 1 U File Edit View Insert Tools Desktop Window Help Cumulative daily log-returns 6 APPL IBM MSFT How 5 4 Warna 3 ya N may not 1 0 2017 2018 2019 2020 2021 2022 Figure 2 File Edit View Insert Tools Desktop Window Help Minimise Daily stocks and SMAS 350 300 APPL price IBM price MSFT price * APPL SMA, lag = 21 APPL SMA, lead = 63 IBM SMA, lag = 21 IBM SMA, lead = 63 MSFT SMA, lag = 21 MSFT SMA, lead = 63 250 200 Prices $ 150 100 50 0 Jan 2017 Jan 2018 Jan 2020 Jan 2021 Jan 2019 Dates Figure 3 X File Edit View Insert Tools Desktop Window Help Minimise 200 180 IBM price IBM SMA, lag = 21 IBM SMA, lead = 63 160 hassan 140 120 100 2017 2018 2019 2020 2021 2022 0.5 0 -0.5 -1 Jan 2017 Jan 2018 Jan 2019 Jan 2020 Jan 2021 Figure 4 U File Edit View Insert Tools Desktop Window Help Market cumulative log-return on IBM vs my strategy 1.5 Market my strategy 1.4 W 1.3 1.2 1.1 1 Cherry 0.9 Eure ay thing ihon 0.8 0.7 0.6 0.5 2017 2018 2019 2020 2021 2022 Figure 5 - U File Edit View Insert Tools Desktop Window Help Efficient frontier 35% 30% 25% 20% Annualized expected return, E[R] 15% 10% 5% 1 0% -5% 0.2 0.25 0.4 0.45 0.3 0.35 Annualized volatility
Step by Step Solution
There are 3 Steps involved in it

Get step-by-step solutions from verified subject matter experts