

Question: By using either Lindo or EXCEL SOLVER , Operatin management VU OPERATIONS MANAGEMENT I SS2021 H. MISSBAUER Master planning in semiconductor manufacturing - exercise Outline
By using either Lindo or EXCEL SOLVER, Operatin management
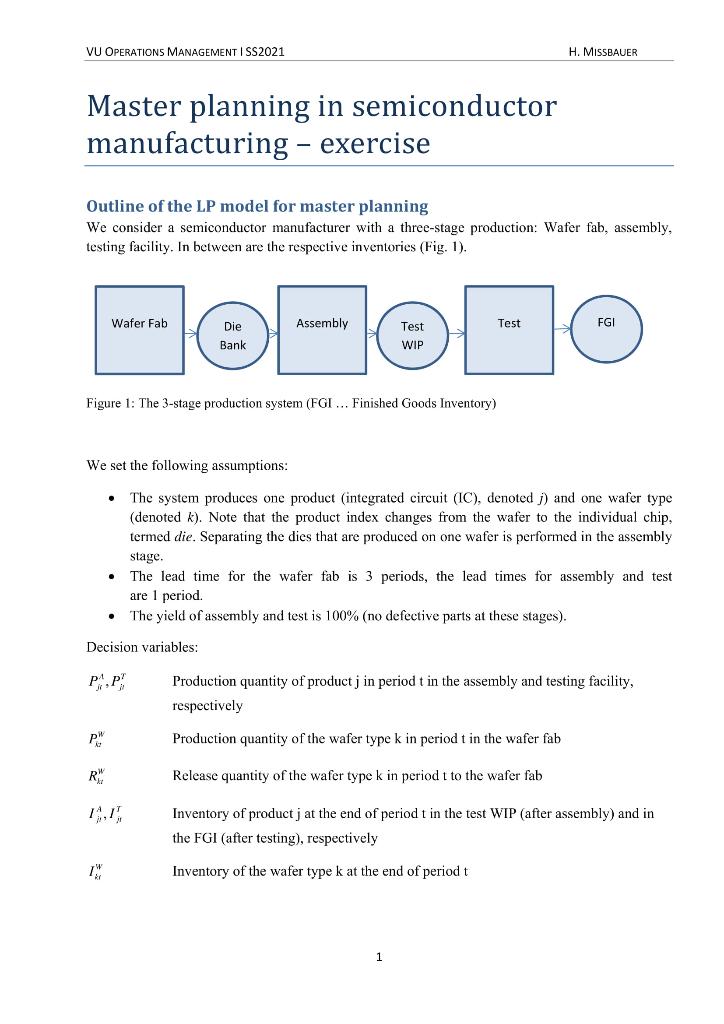
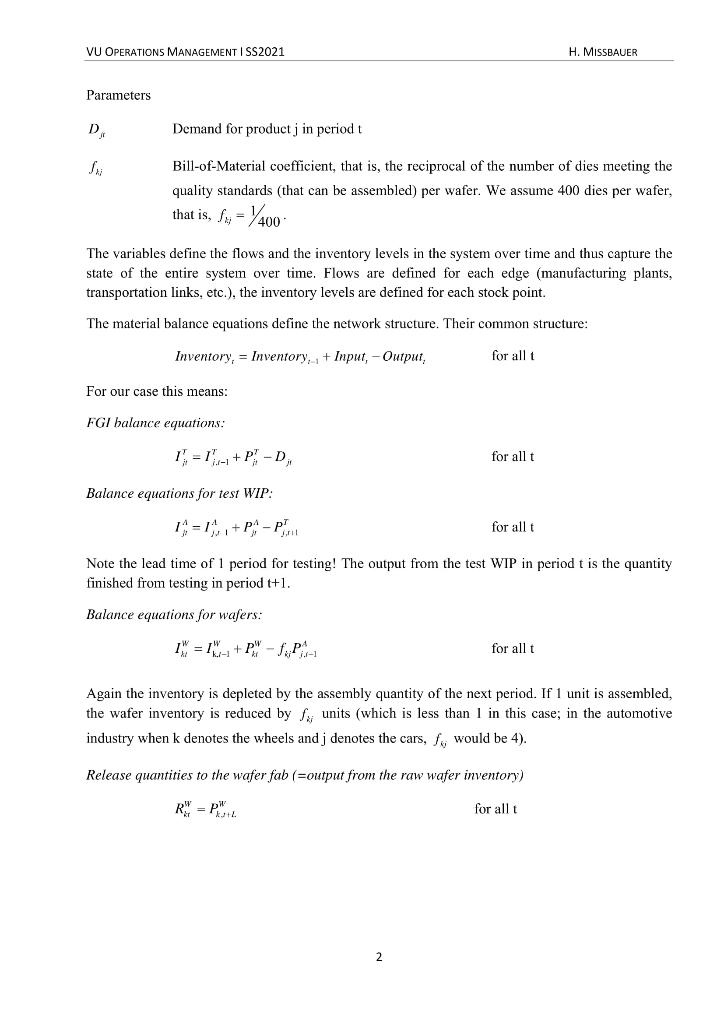
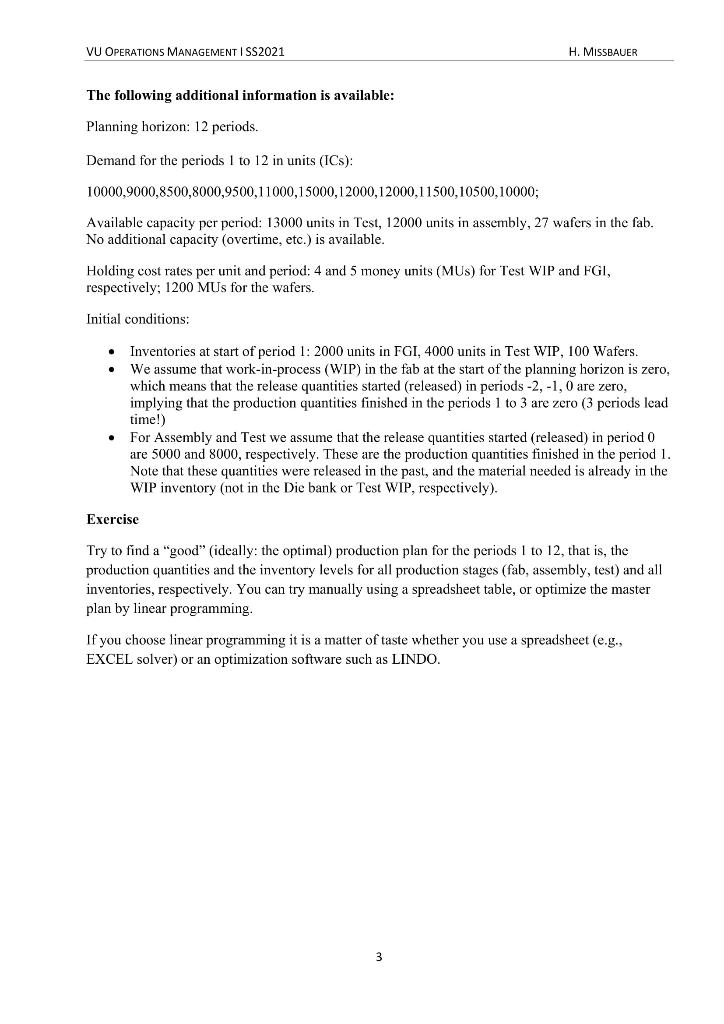
VU OPERATIONS MANAGEMENT I SS2021 H. MISSBAUER Master planning in semiconductor manufacturing - exercise Outline of the LP model for master planning We consider a semiconductor manufacturer with a three-stage production: Wafer fab, assembly, testing facility. In between are the respective inventories (Fig. 1). Wafer Fab Assembly Test FGI Die Bank Test WIP Figure 1: The 3-stage production system (FGI... Finished Goods Inventory) We set the following assumptions: The system produces one product (integrated circuit (IC), denoted j) and one wafer type (denoted k). Note that the product index changes from the wafer to the individual chip, termed die. Separating the dies that are produced on one wafer is performed in the assembly stage. The lead time for the wafer fab is 3 periods, the lead times for assembly and test are I period. The yield of assembly and test is 100% (no defective parts at these stages). . Decision variables: P.p Production quantity of product in period t in the assembly and testing facility, respectively p! Production quantity of the wafer type k in period t in the wafer fab R Release quantity of the wafer type k in period t to the wafer fab Inventory of product j at the end of period t in the test WIP (after assembly) and in the FGI (after testing), respectively 1 Inventory of the wafer type k at the end of period t 1 VU OPERATIONS MANAGEMENT I SS2021 H. MISSBAUER Parameters D Demand for product in period t Bill-of-Material coefficient, that is, the reciprocal of the number of dies meeting the quality standards (that can be assembled) per wafer. We assume 400 dies per wafer, that is, Su = 7400 The variables define the flows and the inventory levels in the system over time and thus capture the state of the entire system over time. Flows are defined for each edge (manufacturing plants, transportation links, etc.), the inventory levels are defined for each stock point. The material balance equations define the network structure. Their common structure: Inventory, = Inventory + Input, -Output, for all t For our case this means: FGI balance equations: 1. = 1/-+P%-D, for all t Balance equations for test WIP: 1=17,+P:-P for all t Note the lead time of 1 period for testing! The output from the test WIP in period t is the quantity finished from testing in period t+1. Balance equations for wafers: 14+PW-AP- for all t Again the inventory is depleted by the assembly quantity of the next period. If 1 unit is assembled, the wafer inventory is reduced by units (which is less than 1 in this case; in the automotive industry when k denotes the wheels and j denotes the cars, fs would be 4). Release quantities to the wafer fab (=output from the raw wafer inventory) R! - for all t 2 VU OPERATIONS MANAGEMENT I SS2021 H. MISSBAUER The following additional information is available: Planning horizon: 12 periods. Demand for the periods 1 to 12 in units (ICs): 10000,9000,8500,8000,9500,11000,15000,12000,12000,11500,10500,10000; Available capacity per period: 13000 units in Test, 12000 units in assembly, 27 wafers in the fab. No additional capacity (overtime, etc.) is available. Holding cost rates per unit and period: 4 and 5 money units (MUS) for Test WIP and FGI, respectively; 1200 MUs for the wafers. Initial conditions: Inventories at start of period 1: 2000 units in FGI, 4000 units in Test WIP, 100 Wafers. We assume that work-in-process (WIP) in the fab at the start of the planning horizon is zero, which means that the release quantities started (released) in periods -2,-1,0 are zero, implying that the production quantities finished in the periods 1 to 3 are zero (3 periods lead time!) For Assembly and Test we assume that the release quantities started (released) in period 0 are 5000 and 8000, respectively. These are the production quantities finished in the period 1. Note that these quantities were released in the past, and the material needed is already in the WIP inventory (not in the Die bank or Test WIP, respectively). . Exercise Try to find a "good" (ideally: the optimal) production plan for the periods 1 to 12, that is, the production quantities and the inventory levels for all production stages (fab, assembly, test) and all inventories, respectively. You can try manually using a spreadsheet table, or optimize the master plan by linear programming. If you choose linear programming it is a matter of taste whether you use a spreadsheet (e.g., EXCEL solver) or an optimization software such as LINDO. 3 VU OPERATIONS MANAGEMENT I SS2021 H. MISSBAUER Master planning in semiconductor manufacturing - exercise Outline of the LP model for master planning We consider a semiconductor manufacturer with a three-stage production: Wafer fab, assembly, testing facility. In between are the respective inventories (Fig. 1). Wafer Fab Assembly Test FGI Die Bank Test WIP Figure 1: The 3-stage production system (FGI... Finished Goods Inventory) We set the following assumptions: The system produces one product (integrated circuit (IC), denoted j) and one wafer type (denoted k). Note that the product index changes from the wafer to the individual chip, termed die. Separating the dies that are produced on one wafer is performed in the assembly stage. The lead time for the wafer fab is 3 periods, the lead times for assembly and test are I period. The yield of assembly and test is 100% (no defective parts at these stages). . Decision variables: P.p Production quantity of product in period t in the assembly and testing facility, respectively p! Production quantity of the wafer type k in period t in the wafer fab R Release quantity of the wafer type k in period t to the wafer fab Inventory of product j at the end of period t in the test WIP (after assembly) and in the FGI (after testing), respectively 1 Inventory of the wafer type k at the end of period t 1 VU OPERATIONS MANAGEMENT I SS2021 H. MISSBAUER Parameters D Demand for product in period t Bill-of-Material coefficient, that is, the reciprocal of the number of dies meeting the quality standards (that can be assembled) per wafer. We assume 400 dies per wafer, that is, Su = 7400 The variables define the flows and the inventory levels in the system over time and thus capture the state of the entire system over time. Flows are defined for each edge (manufacturing plants, transportation links, etc.), the inventory levels are defined for each stock point. The material balance equations define the network structure. Their common structure: Inventory, = Inventory + Input, -Output, for all t For our case this means: FGI balance equations: 1. = 1/-+P%-D, for all t Balance equations for test WIP: 1=17,+P:-P for all t Note the lead time of 1 period for testing! The output from the test WIP in period t is the quantity finished from testing in period t+1. Balance equations for wafers: 14+PW-AP- for all t Again the inventory is depleted by the assembly quantity of the next period. If 1 unit is assembled, the wafer inventory is reduced by units (which is less than 1 in this case; in the automotive industry when k denotes the wheels and j denotes the cars, fs would be 4). Release quantities to the wafer fab (=output from the raw wafer inventory) R! - for all t 2 VU OPERATIONS MANAGEMENT I SS2021 H. MISSBAUER The following additional information is available: Planning horizon: 12 periods. Demand for the periods 1 to 12 in units (ICs): 10000,9000,8500,8000,9500,11000,15000,12000,12000,11500,10500,10000; Available capacity per period: 13000 units in Test, 12000 units in assembly, 27 wafers in the fab. No additional capacity (overtime, etc.) is available. Holding cost rates per unit and period: 4 and 5 money units (MUS) for Test WIP and FGI, respectively; 1200 MUs for the wafers. Initial conditions: Inventories at start of period 1: 2000 units in FGI, 4000 units in Test WIP, 100 Wafers. We assume that work-in-process (WIP) in the fab at the start of the planning horizon is zero, which means that the release quantities started (released) in periods -2,-1,0 are zero, implying that the production quantities finished in the periods 1 to 3 are zero (3 periods lead time!) For Assembly and Test we assume that the release quantities started (released) in period 0 are 5000 and 8000, respectively. These are the production quantities finished in the period 1. Note that these quantities were released in the past, and the material needed is already in the WIP inventory (not in the Die bank or Test WIP, respectively). . Exercise Try to find a "good" (ideally: the optimal) production plan for the periods 1 to 12, that is, the production quantities and the inventory levels for all production stages (fab, assembly, test) and all inventories, respectively. You can try manually using a spreadsheet table, or optimize the master plan by linear programming. If you choose linear programming it is a matter of taste whether you use a spreadsheet (e.g., EXCEL solver) or an optimization software such as LINDO. 3
Step by Step Solution
There are 3 Steps involved in it
1 Expert Approved Answer
Step: 1 Unlock

Question Has Been Solved by an Expert!
Get step-by-step solutions from verified subject matter experts
Step: 2 Unlock
Step: 3 Unlock