

Question: You must show how you arrive at the answers in order to receive full points: (Consumption) Use the following data to answer the questions
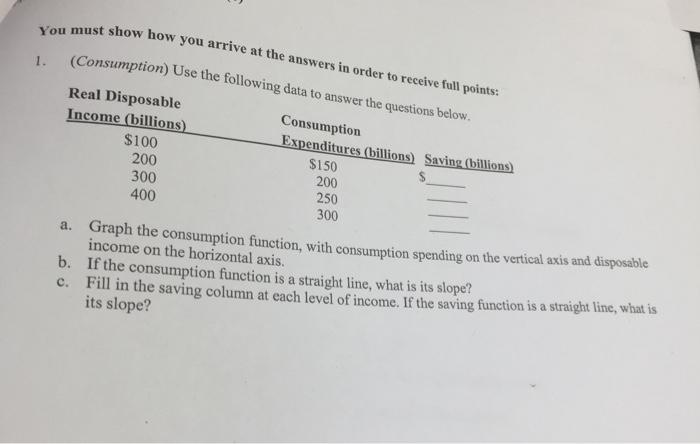
You must show how you arrive at the answers in order to receive full points: (Consumption) Use the following data to answer the questions below. Consumption Expenditures (billions) Saving (billions) $150 200 250 300 1. Real Disposable Income (billions) $100 200 300 400 a. Graph the consumption function, with consumption spending on the vertical axis and disposable income on the horizontal axis. b. If the consumption function is a straight line, what is its slope? c. Fill in the saving column at each level of income. If the saving function is a straight line, what is its slope?
Step by Step Solution
3.42 Rating (158 Votes )
There are 3 Steps involved in it
Consumption function can be defined as the schedule detailing the relationship between aggregate con... View full answer

Get step-by-step solutions from verified subject matter experts