

Question: by using MATLAB can you help be to solve this: Plotting Plot y sin(2nx) as a smooth curve for o s x s 2. Use
by using MATLAB can you help be to solve this:
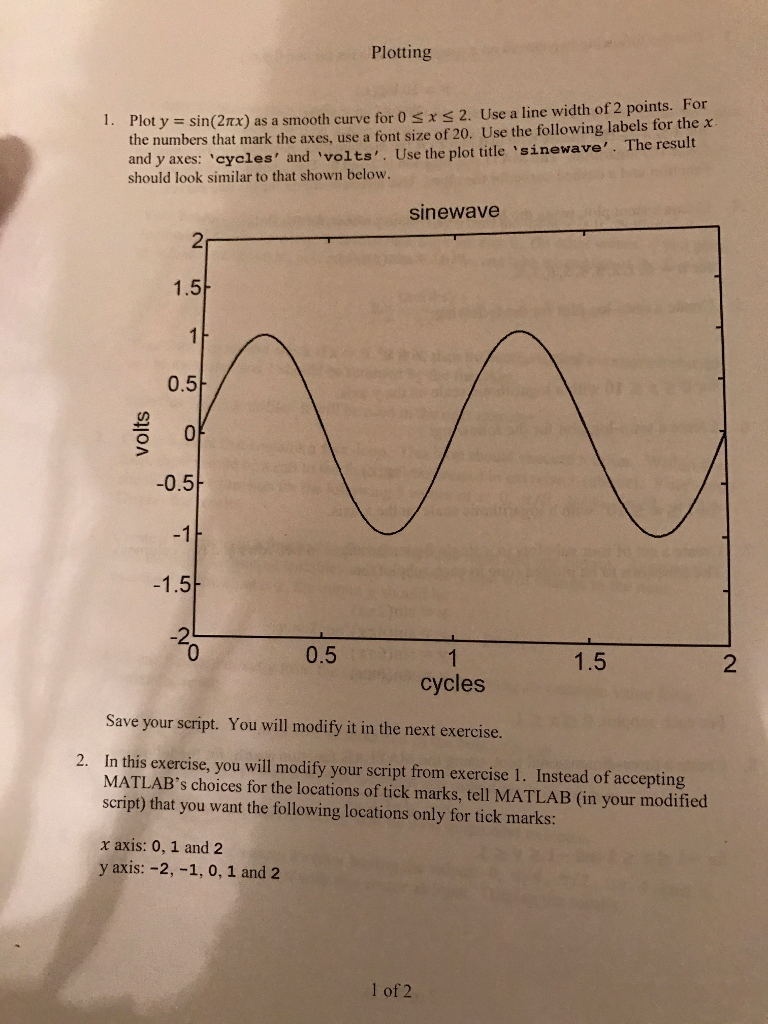
Plotting Plot y sin(2nx) as a smooth curve for o s x s 2. Use a line width of 2 points. For the numbers that mark the axes, use a font size of 20. Use the following labels for the x 1. and y axes: cycles' and volts Use the plot title sinewave The result should look similar to that shown below. Sine Wave 1.5 0.5 0.5 1.5 0.5 cycles Save your script. You will modify it in the next exercise. 2. In this exercise, you will modify your script from exercise 1. Instead of accepting MATLAB's choices for the locations of tick marks, tell MATLAB (in your modified script) that you want the following locations only for tick marks: x axis: 0, 1 and 2 y axis: -2, 1, 0, 1 and 2 l of 2
Step by Step Solution
There are 3 Steps involved in it

Get step-by-step solutions from verified subject matter experts