

Question: By using R language this project contains some blanks made by 3 people with different position, each column represents a posture LBFD stands for -->left
By using R language
this project contains some blanks made by 3 people with different position, each column represents a posture
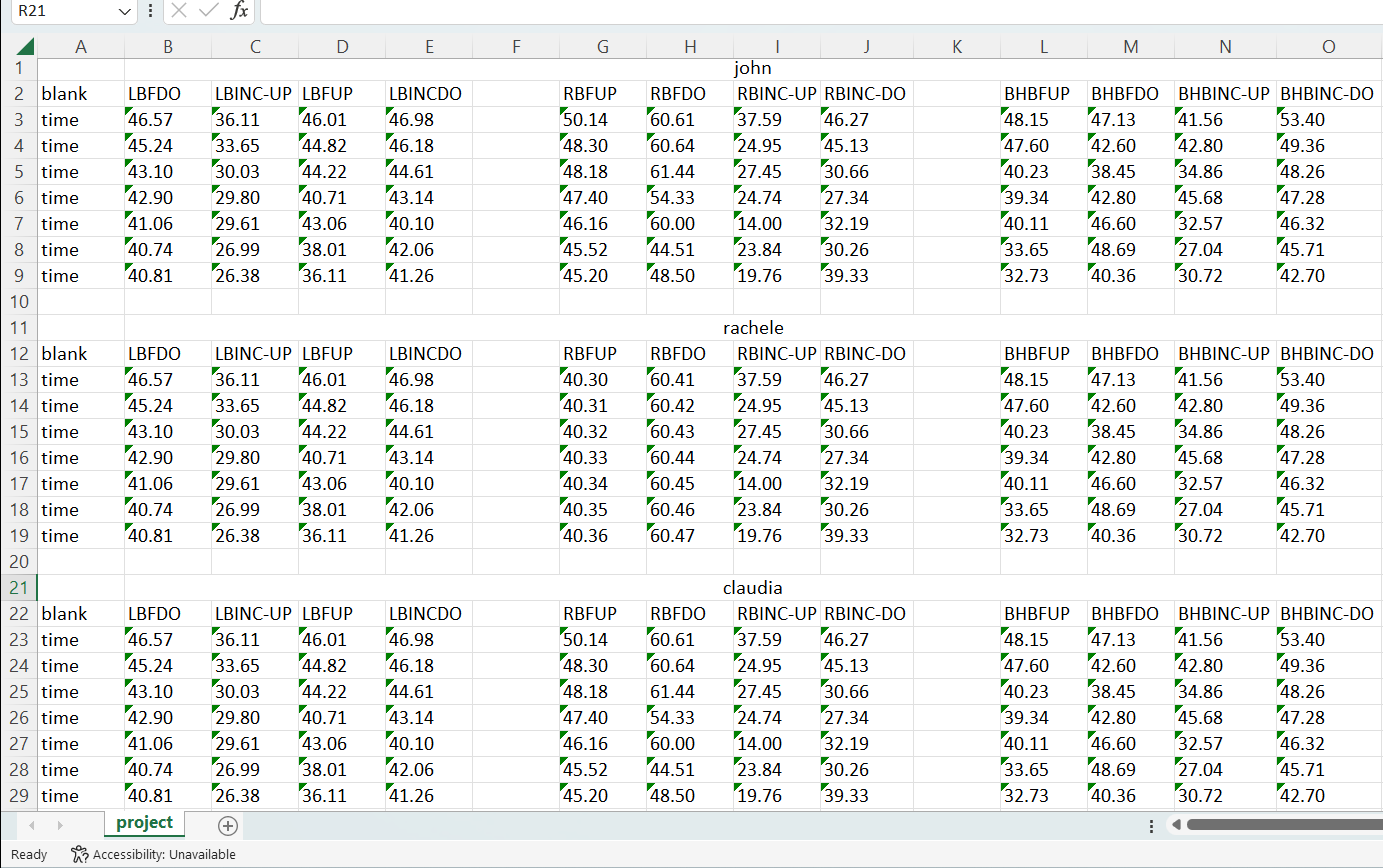
LBFD stands for -->left hand blank feet down , LBINCUP --> left hand blank with incline,feet up .. and so on
you can just put random data, the code and the plots are wanted
Data analysis This project requires studying the change in time as a result of different postures, types, and inclinations.By R language It is required to : - plot boxplots, steam and leaf plots, and bar charts to visualise the collected data. - calculate the descriptive statistics for each posture, type, and inclination. - compare postures, types, and inclinations. - plot appropriate plots to show the change in time when one of the postures is fixed show the change in the average time when inclination or type changes. You can support it by performing calculations. - repeat the previous one when the inclination is fixed and when the type is fixed.
Step by Step Solution
There are 3 Steps involved in it

Get step-by-step solutions from verified subject matter experts