

Question: C. 10. Using the data in Table 10.2, a. What was the average dividend yield for the SP500 from 20022014? b. What was the volatility
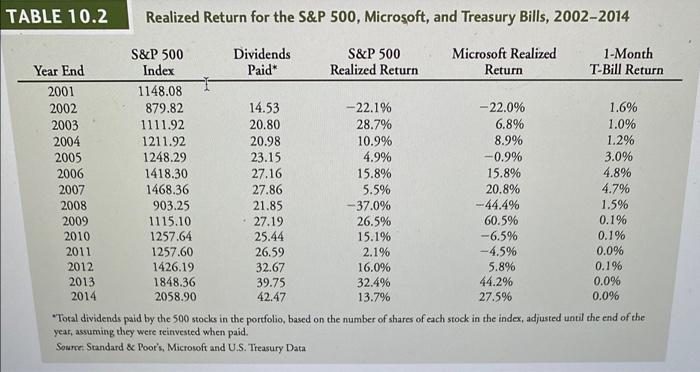
C. 10. Using the data in Table 10.2, a. What was the average dividend yield for the SP500 from 20022014? b. What was the volatility of the dividend yield? What was the average annual return of the SP500 from 2002-2014 excluding dividends (i.e., from capital gains only)? d. What was the volatility of the S&P 500 returns from capital gains? e. Were dividends or capital gains a more important component of the S&P 500's average returns during this period? Which were the more important source of volatility? TABLE 10.2 Realized Return for the S&P 500, Microsoft, and Treasury Bills, 2002-2014 S&P 500 Dividends S&P 500 Microsoft Realized 1-Month Year End Index Paid Realized Return Return T-Bill Return 2001 1148.08 2002 879.82 14.53 -22.1% -22.0% 1.6% 2003 1111.92 20.80 28.7% 6.8% 1.0% 2004 1211.92 20.98 10.9% 8.9% 1.29 2005 1248.29 23.15 4.9% -0.9% 3.0% 2006 1418.30 27.16 15.8% 15.8% 4.896 2007 1468.36 27.86 5.5% 20.8% 4.7% 2008 903.25 21.85 -37.0% -44.4% 1.5% 2009 1115.10 27.19 26.5% 60.5% 0.1% 2010 1257.64 25.44 15.1% -6.5% 0.1% 2011 1257.60 26.59 2.196 -4.5% 0.0% 2012 1426.19 32.67 16.0% 5.8% 0.196 2013 1848.36 39.75 32.4% 44.2% 0.0% 2014 2058.90 42.47 13.7% 27.5% 0.096 "Total dividends paid by the 500 stocks in the portfolio, based on the number of shares of each stock in the index, adjusted until the end of the year, assuming they were reinvested when paid. Source: Standard & Poor's, Microsoft and U.S. Treasury Data
Step by Step Solution
There are 3 Steps involved in it

Get step-by-step solutions from verified subject matter experts