

Question: Q1 Q2 Using the data in the table a. What was the average dividend yield for the S&P 500 from 2005-2017? b. What was the
Q1
Q2
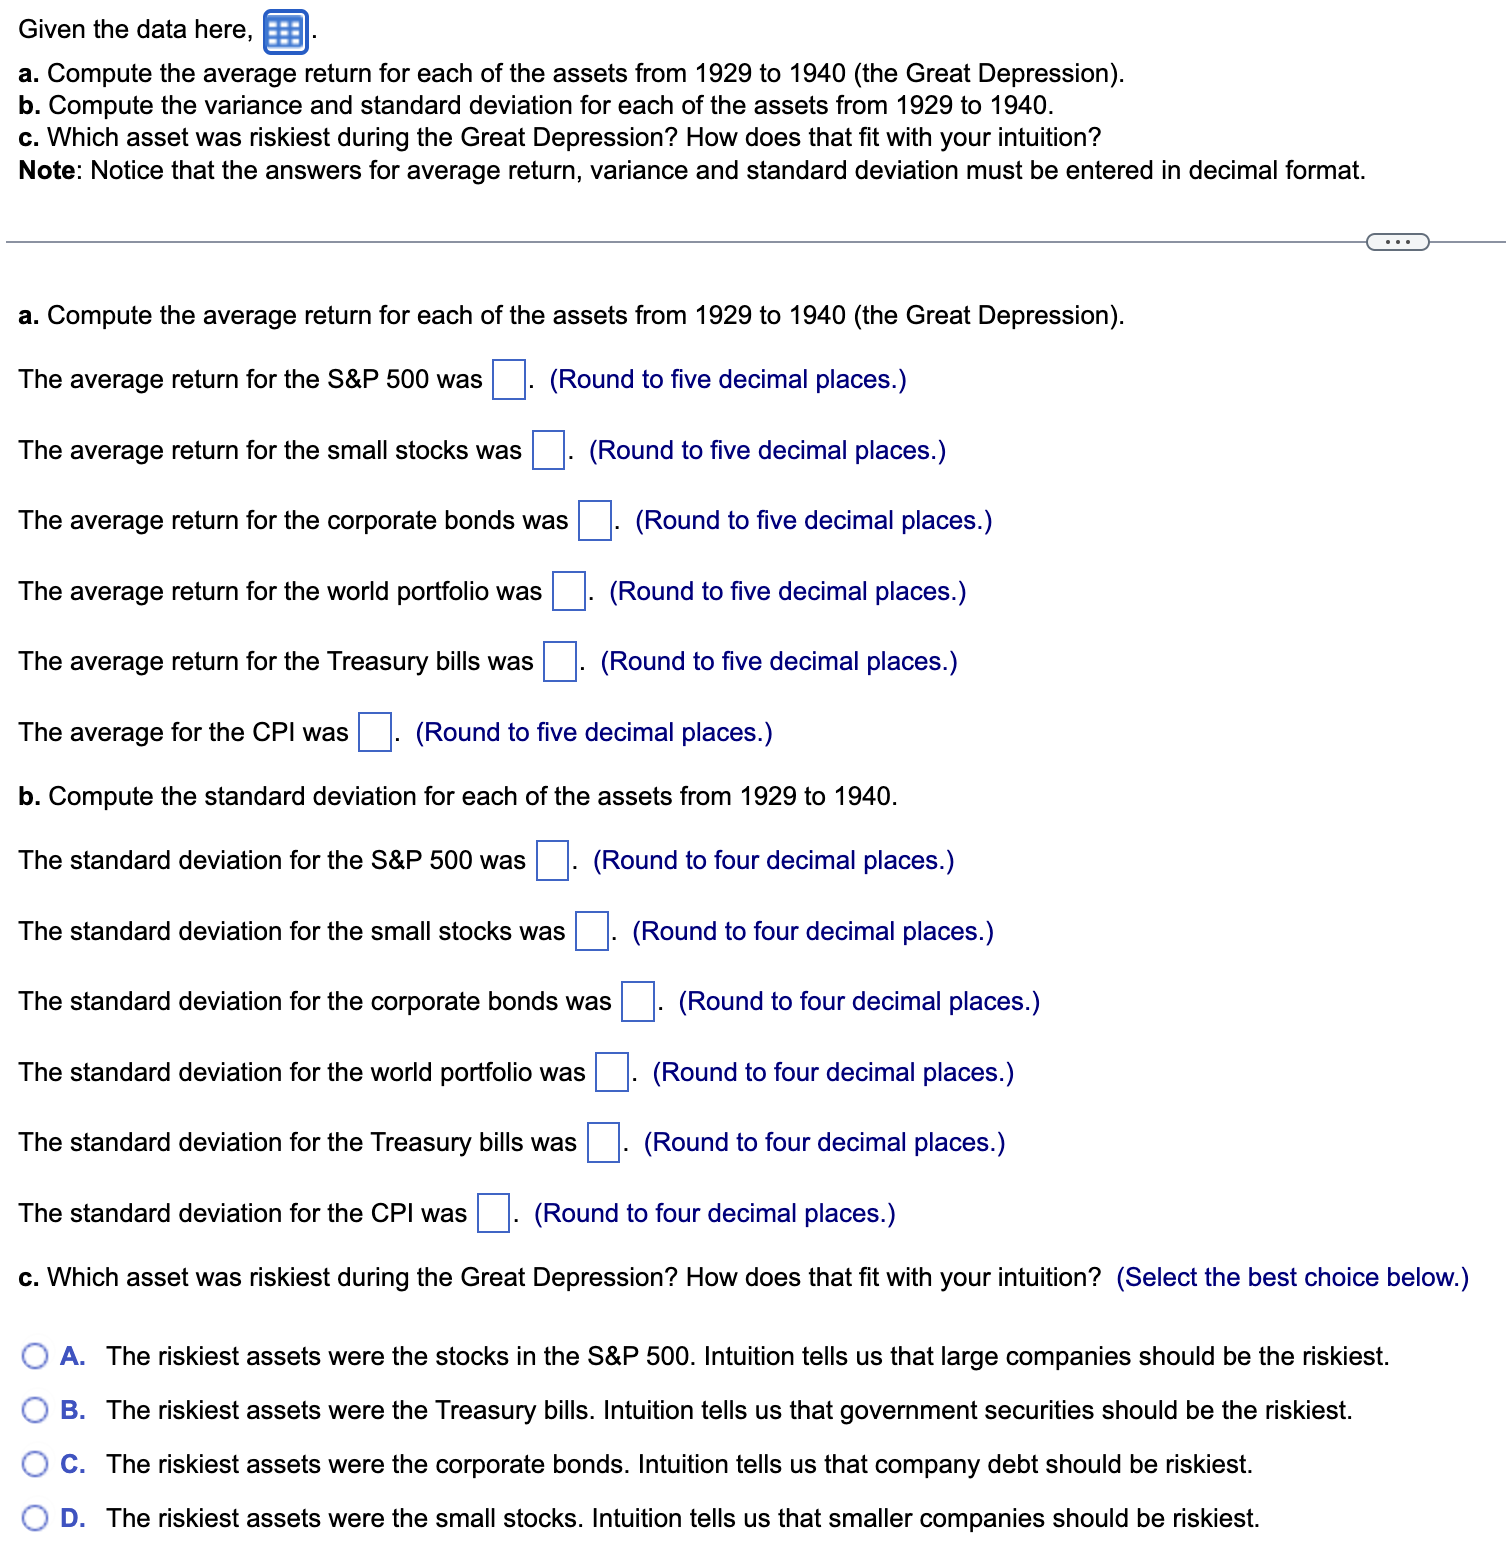
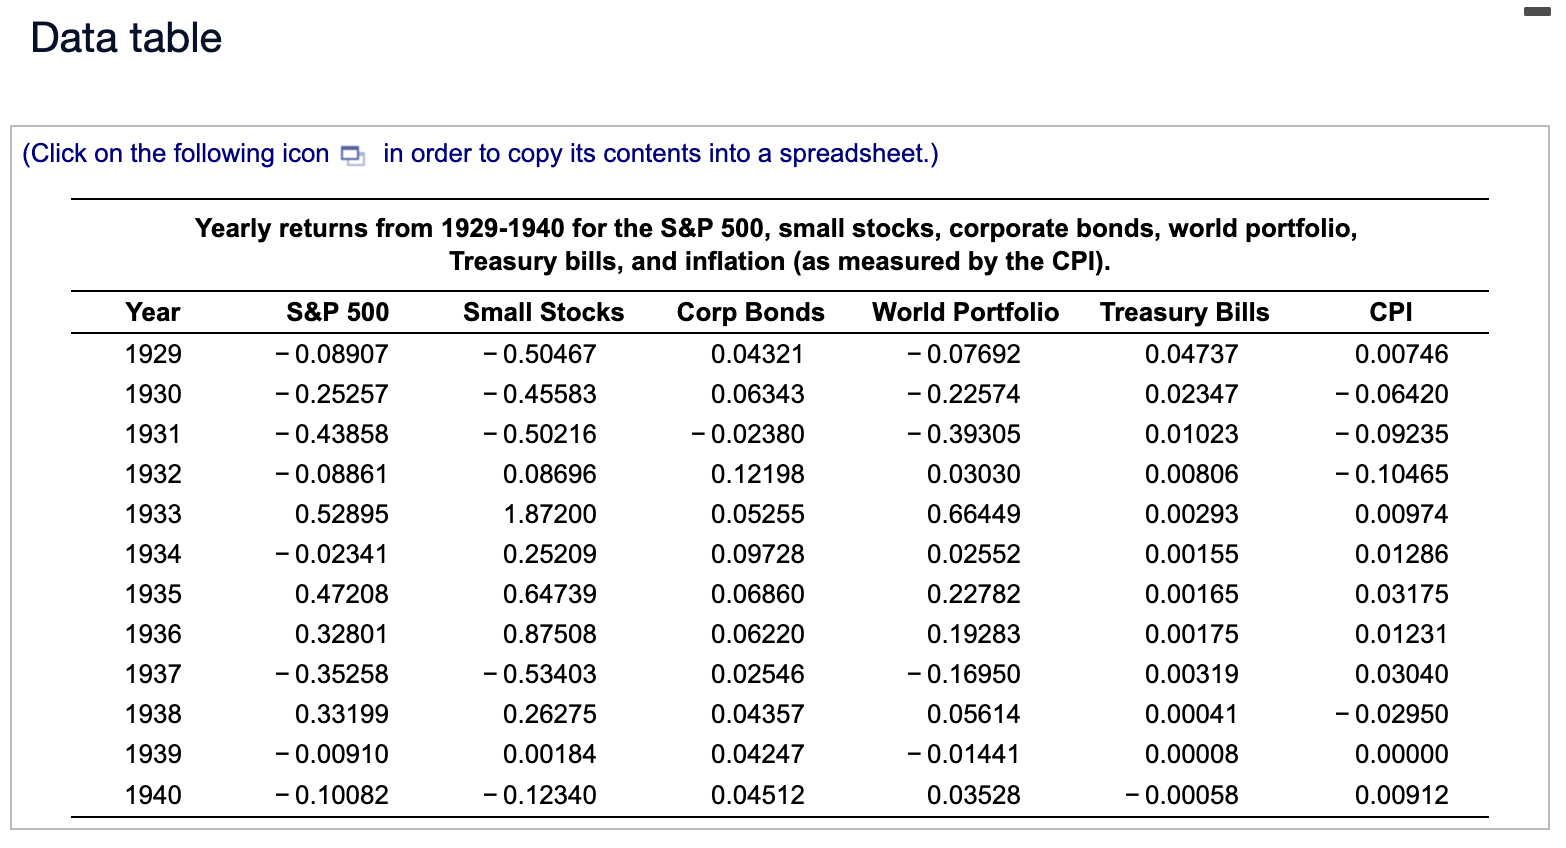
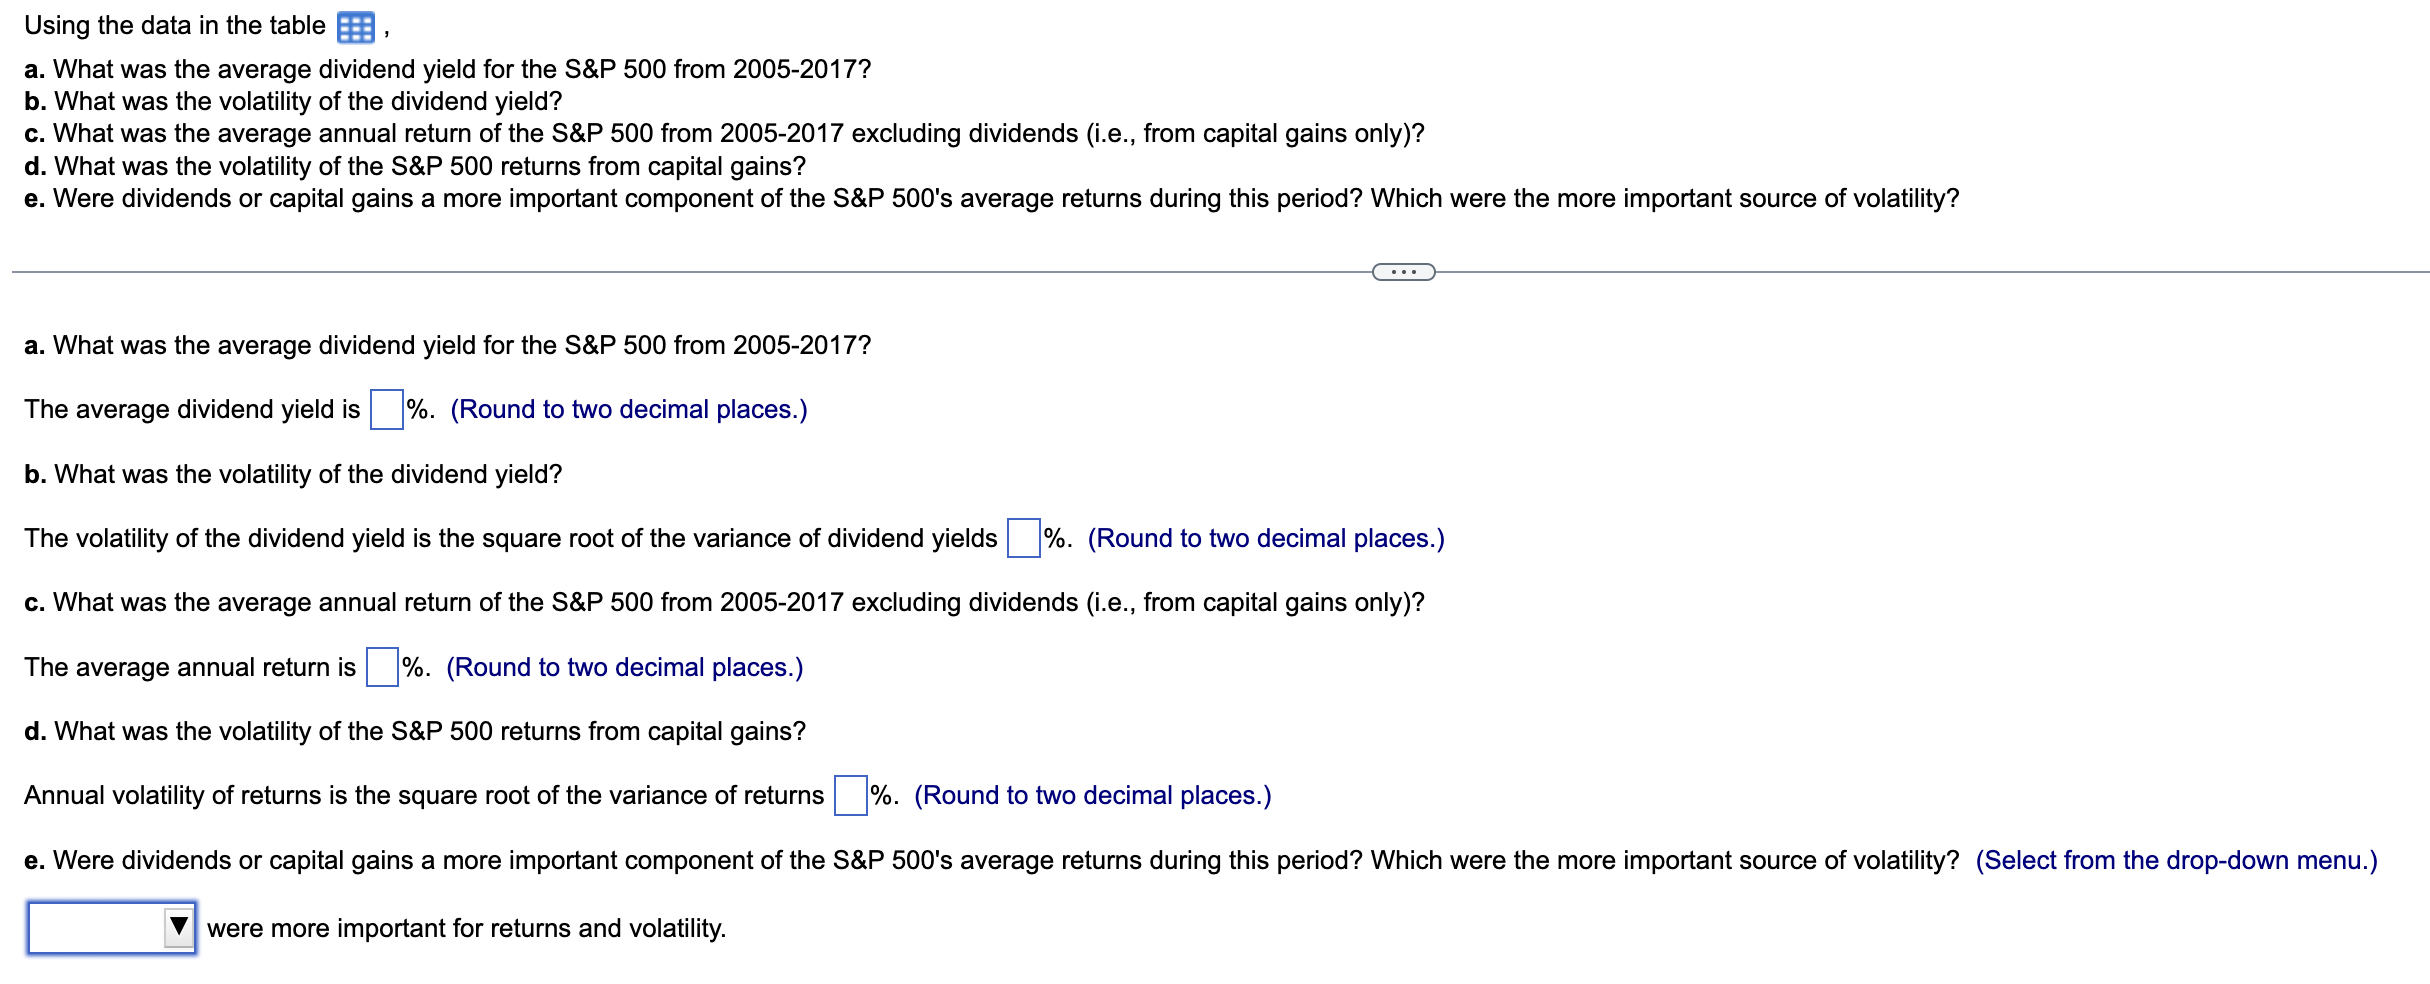
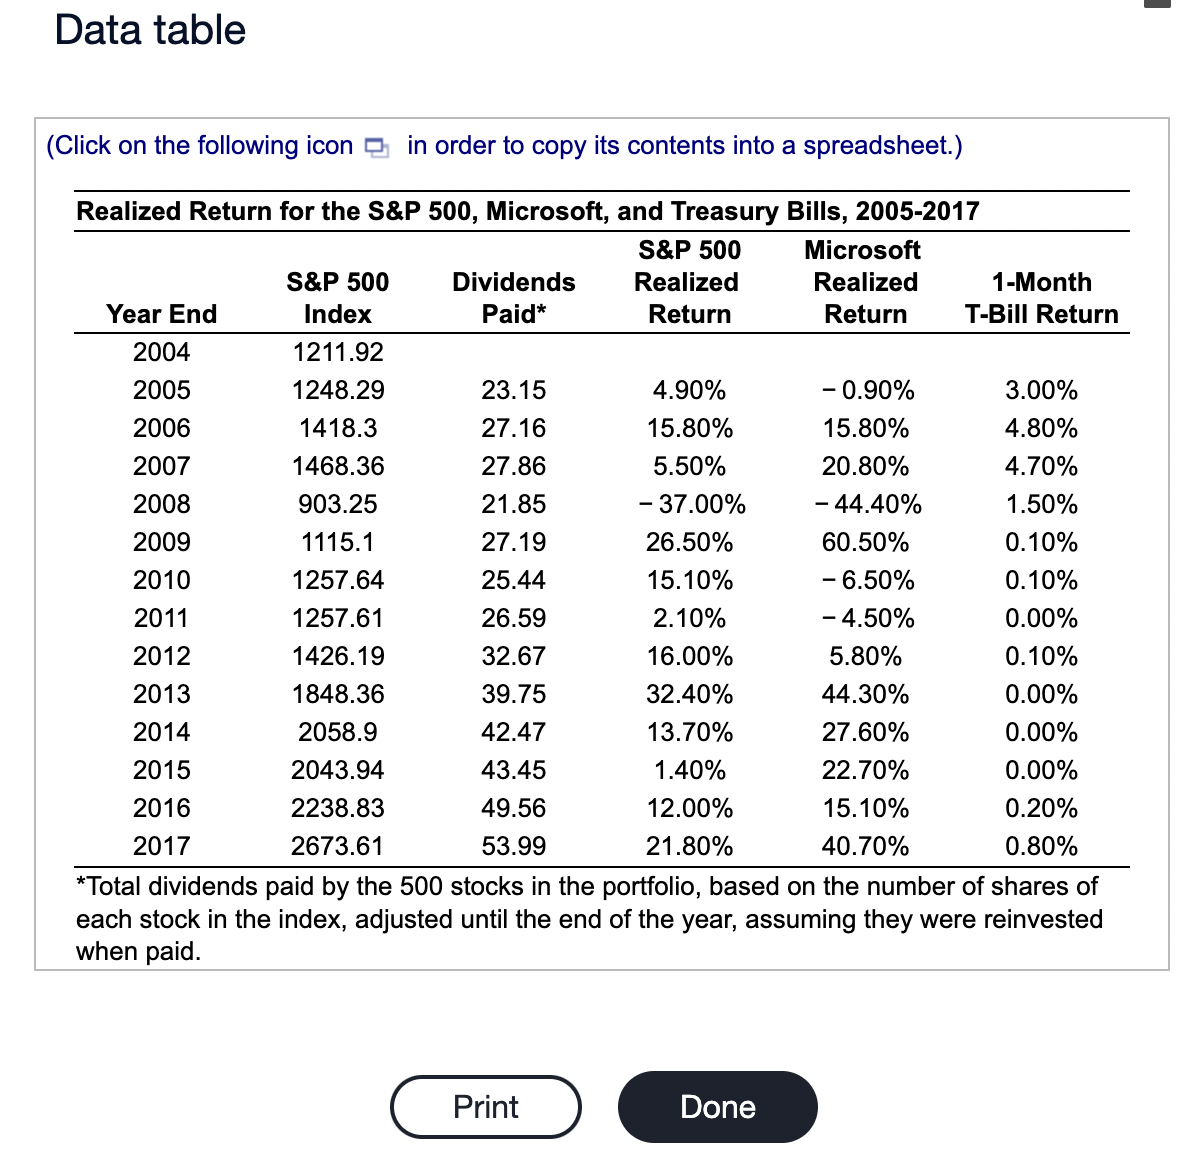
Using the data in the table a. What was the average dividend yield for the S\&P 500 from 2005-2017? b. What was the volatility of the dividend yield? c. What was the average annual return of the S\&P 500 from 2005-2017 excluding dividends (i.e., from capital gains only)? d. What was the volatility of the S\&P 500 returns from capital gains? e. Were dividends or capital gains a more important component of the S\&P 500's average returns during this period? Which were the more important source of volatility? a. What was the average dividend yield for the S\&P 500 from 2005-2017? The average dividend yield is %. (Round to two decimal places.) b. What was the volatility of the dividend yield? The volatility of the dividend yield is the square root of the variance of dividend yields \%. (Round to two decimal places.) c. What was the average annual return of the S\&P 500 from 2005-2017 excluding dividends (i.e., from capital gains only)? The average annual return is \%. (Round to two decimal places.) d. What was the volatility of the S\&P 500 returns from capital gains? Annual volatility of returns is the square root of the variance of returns %. (Round to two decimal places.) were more important for returns and volatility. Data table (Click on the following icon in order to copy its contents into a spreadsheet.) each stock in the index, adjusted until the end of the year, assuming they were reinvested when paid. Given the data here, a. Compute the average return for each of the assets from 1929 to 1940 (the Great Depression). b. Compute the variance and standard deviation for each of the assets from 1929 to 1940. c. Which asset was riskiest during the Great Depression? How does that fit with your intuition? Note: Notice that the answers for average return, variance and standard deviation must be entered in decimal format. a. Compute the average return for each of the assets from 1929 to 1940 (the Great Depression). The average return for the S\&P 500 was The average return for the small stocks was The average return for the corporate bonds was The average return for the world portfolio was The average return for the Treasury bills was The average for the CPI was The average for the CPI was b. Compute the standard deviation for each of the assets from 1929 to 1940. The standard deviation for the S\&P 500 was The standard deviation for the small stocks was The standard deviation for the corporate bonds was The standard deviation for the world portfolio was The standard deviation for the Treasury bills was (Round to four decimal places.) (Round to four decimal places.) (Round to four decimal places.) (Round to four decimal places.) (Round to four decimal places.) (Round to four decimal places.) (Round to four decimal places.) c. Which asset was riskiest during the Great Depression? How does that fit with your intuition? (Select the best choice below.) A. The riskiest assets were the stocks in the S\&P 500. Intuition tells us that large companies should be the riskiest. B. The riskiest assets were the Treasury bills. Intuition tells us that government securities should be the riskiest. C. The riskiest assets were the corporate bonds. Intuition tells us that company debt should be riskiest. D. The riskiest assets were the small stocks. Intuition tells us that smaller companies should be riskiest. Data table (Click on the following icon in order to copy its contents into a spreadsheet.) Yearly returns from 1929-1940 for the S\&P 500, small stocks, corporate bonds, world portfolio, Treasury bills, and inflation (as measured by the CPI)
Step by Step Solution
There are 3 Steps involved in it

Get step-by-step solutions from verified subject matter experts