

Question: c . Consider the process flowchart in the figure below: Jobs The estimated activity time and resources for each activity in the process are shown
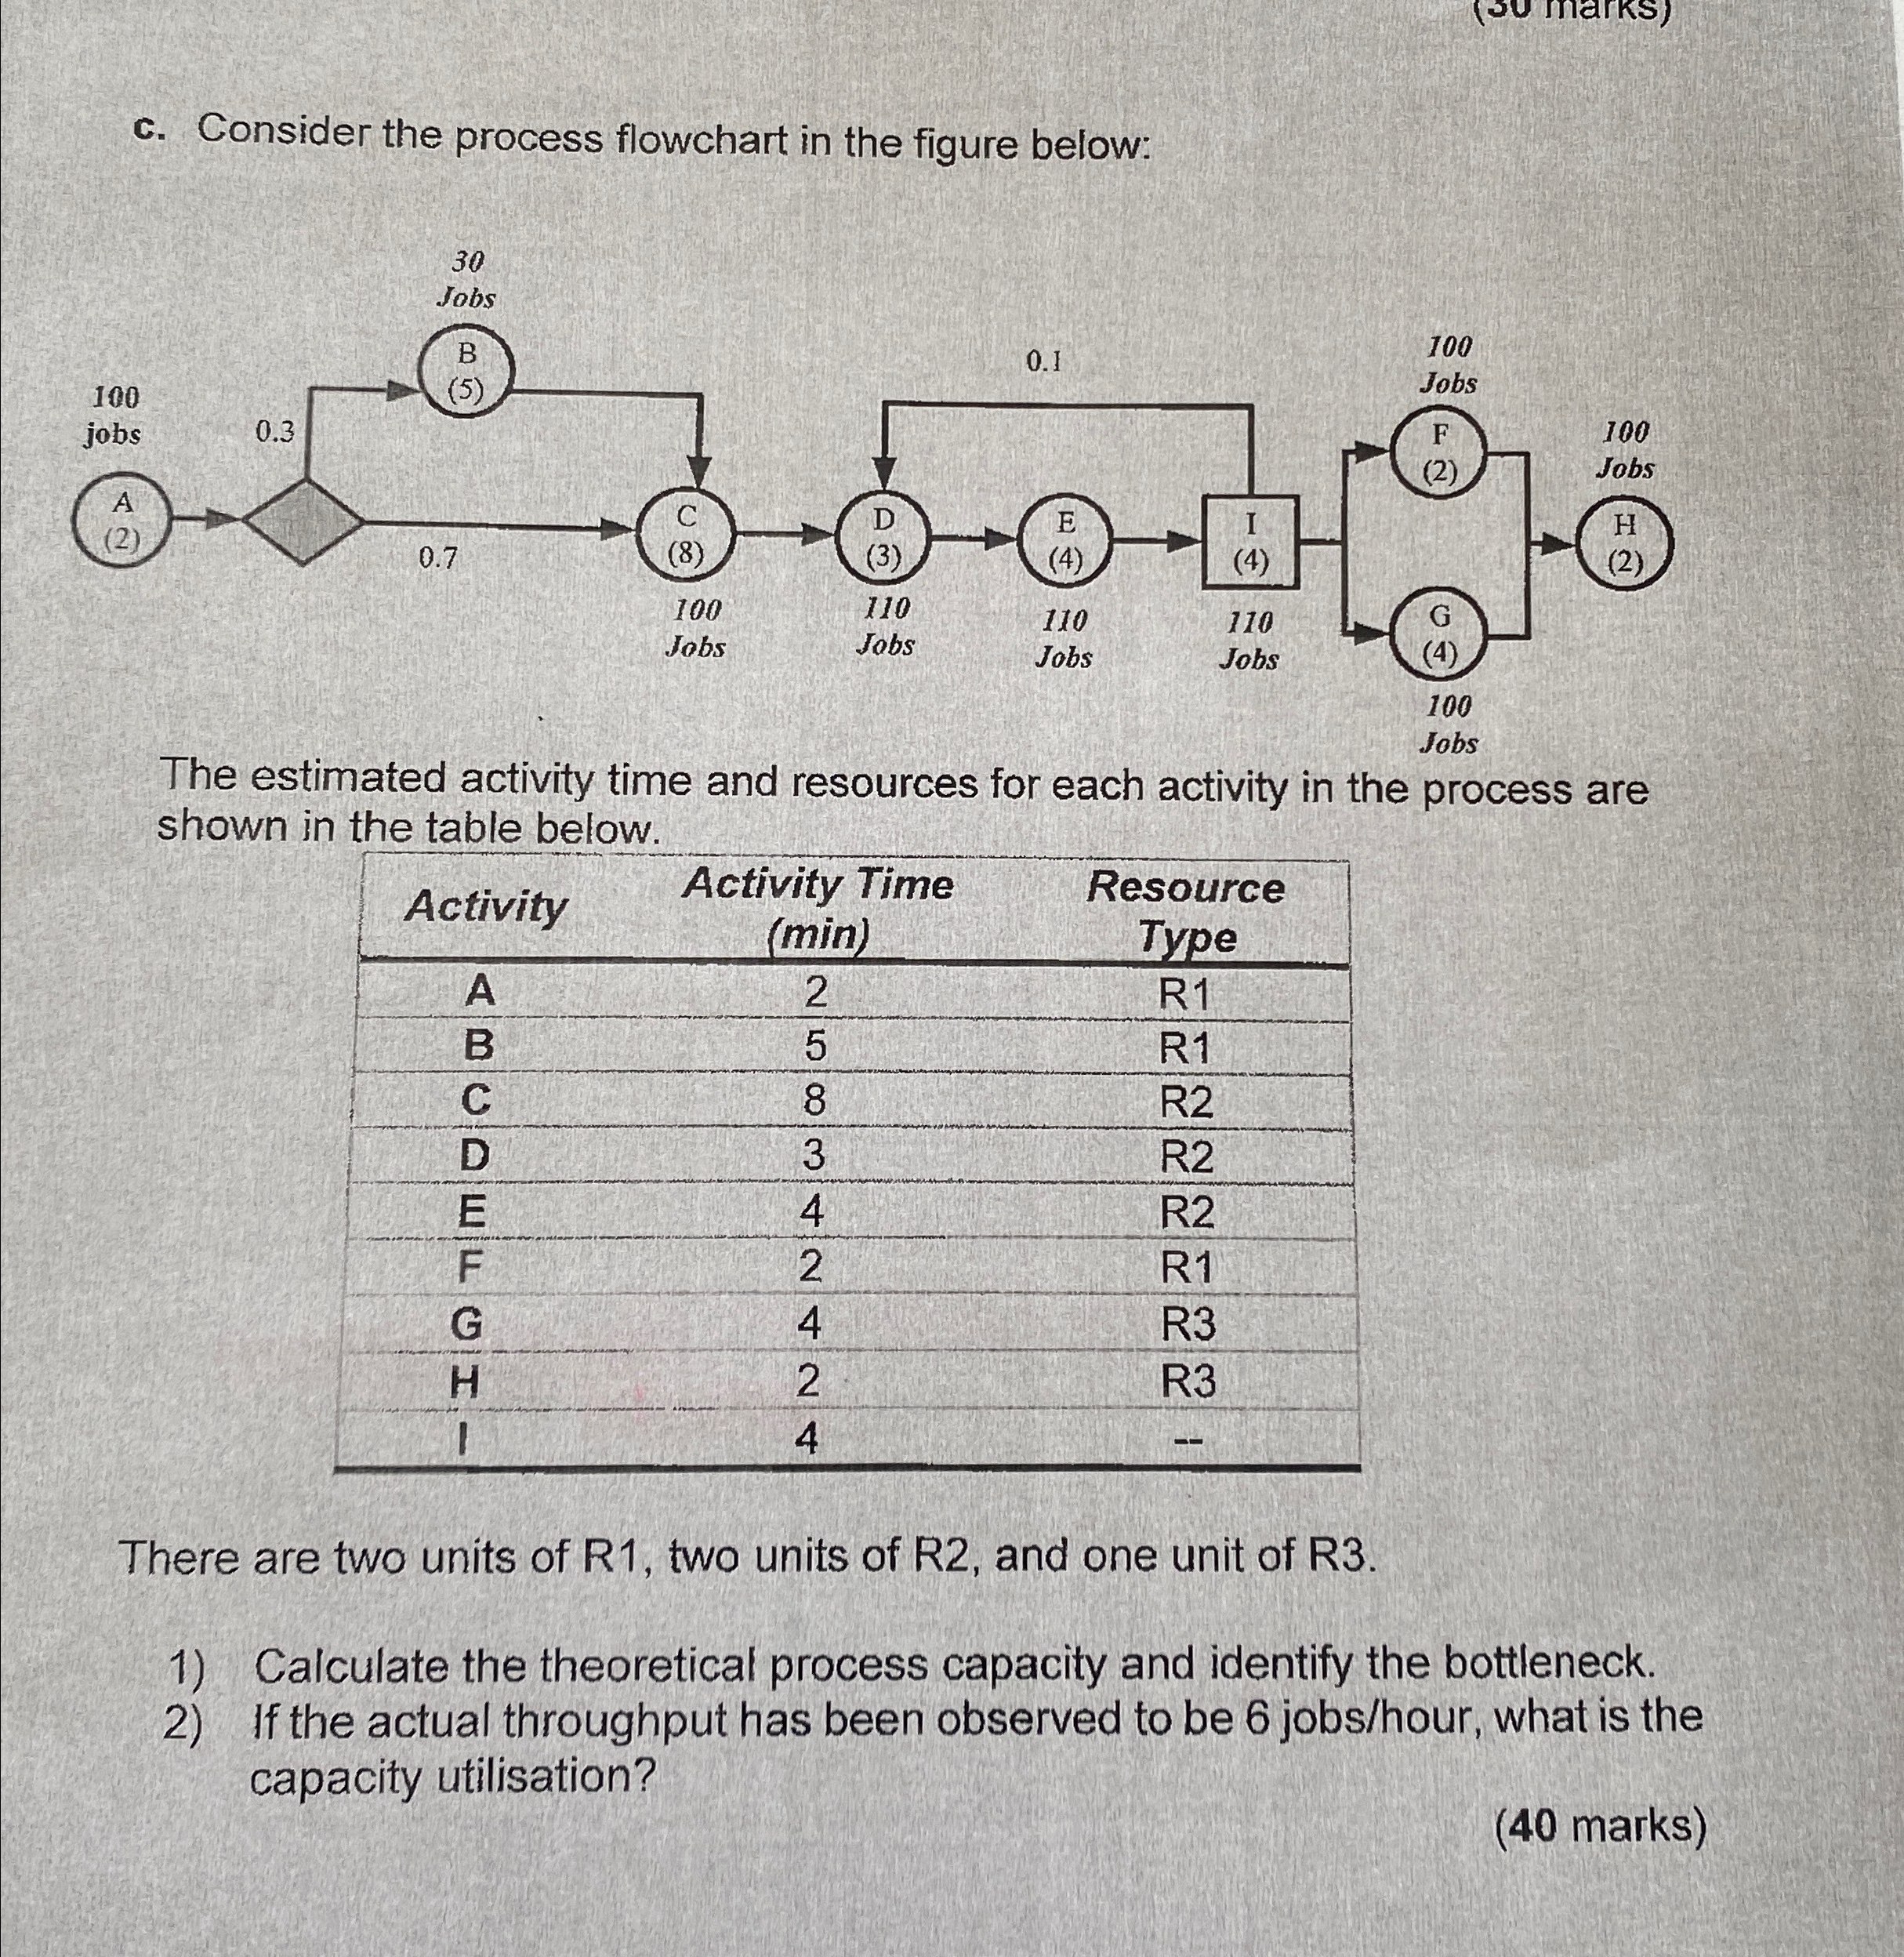
c Consider the process flowchart in the figure below:
Jobs
The estimated activity time and resources for each activity in the process are shown in the table below.
tableActivitytableActivity TimemintableResourceTypeARBRCRDRERFRGRHRI
There are two units of two units of and one unit of
Calculate the theoretical process capacity and identify the bottleneck.
If the actual throughput has been observed to be jobshour what is the capacity utilisation?
marks
Step by Step Solution
There are 3 Steps involved in it
1 Expert Approved Answer
Step: 1 Unlock

Question Has Been Solved by an Expert!
Get step-by-step solutions from verified subject matter experts
Step: 2 Unlock
Step: 3 Unlock