

Question: ( c ) Create a bar plot to visualize the average income for people with different education levels, your output should look similar as the
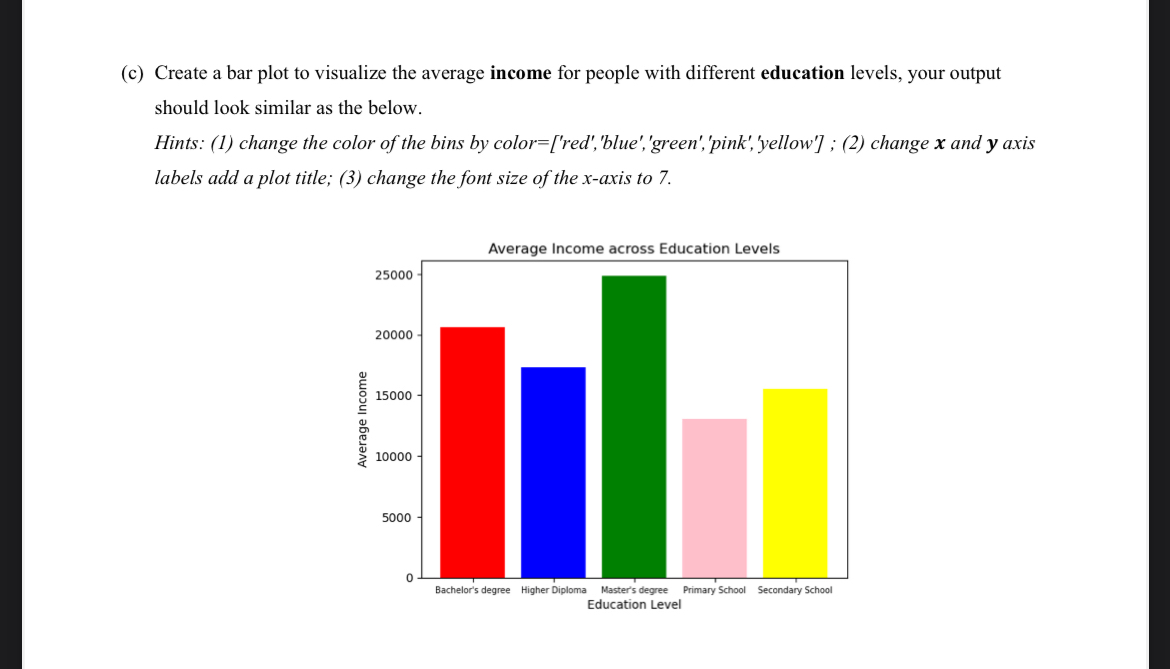
c Create a bar plot to visualize the average income for people with different education levels, your output should look similar as the below.
Hints: change the color of the bins by colorred'blue','green','pink','yellow' ; change and axis labels add a plot title; change the font size of the axis to
Step by Step Solution
There are 3 Steps involved in it
1 Expert Approved Answer
Step: 1 Unlock

Question Has Been Solved by an Expert!
Get step-by-step solutions from verified subject matter experts
Step: 2 Unlock
Step: 3 Unlock