

Question: c ) Determine the approximate population after 1 0 days. Which tool do you pref fop to use for this: the equation or the graph?
c Determine the approximate population after days. Which tool do you pref fop to use for this: the equation or the graph? Explain why.
d Detormine the approximate population after months. Which tool do you prefer to use for this: the equation or the graph? Explain why.
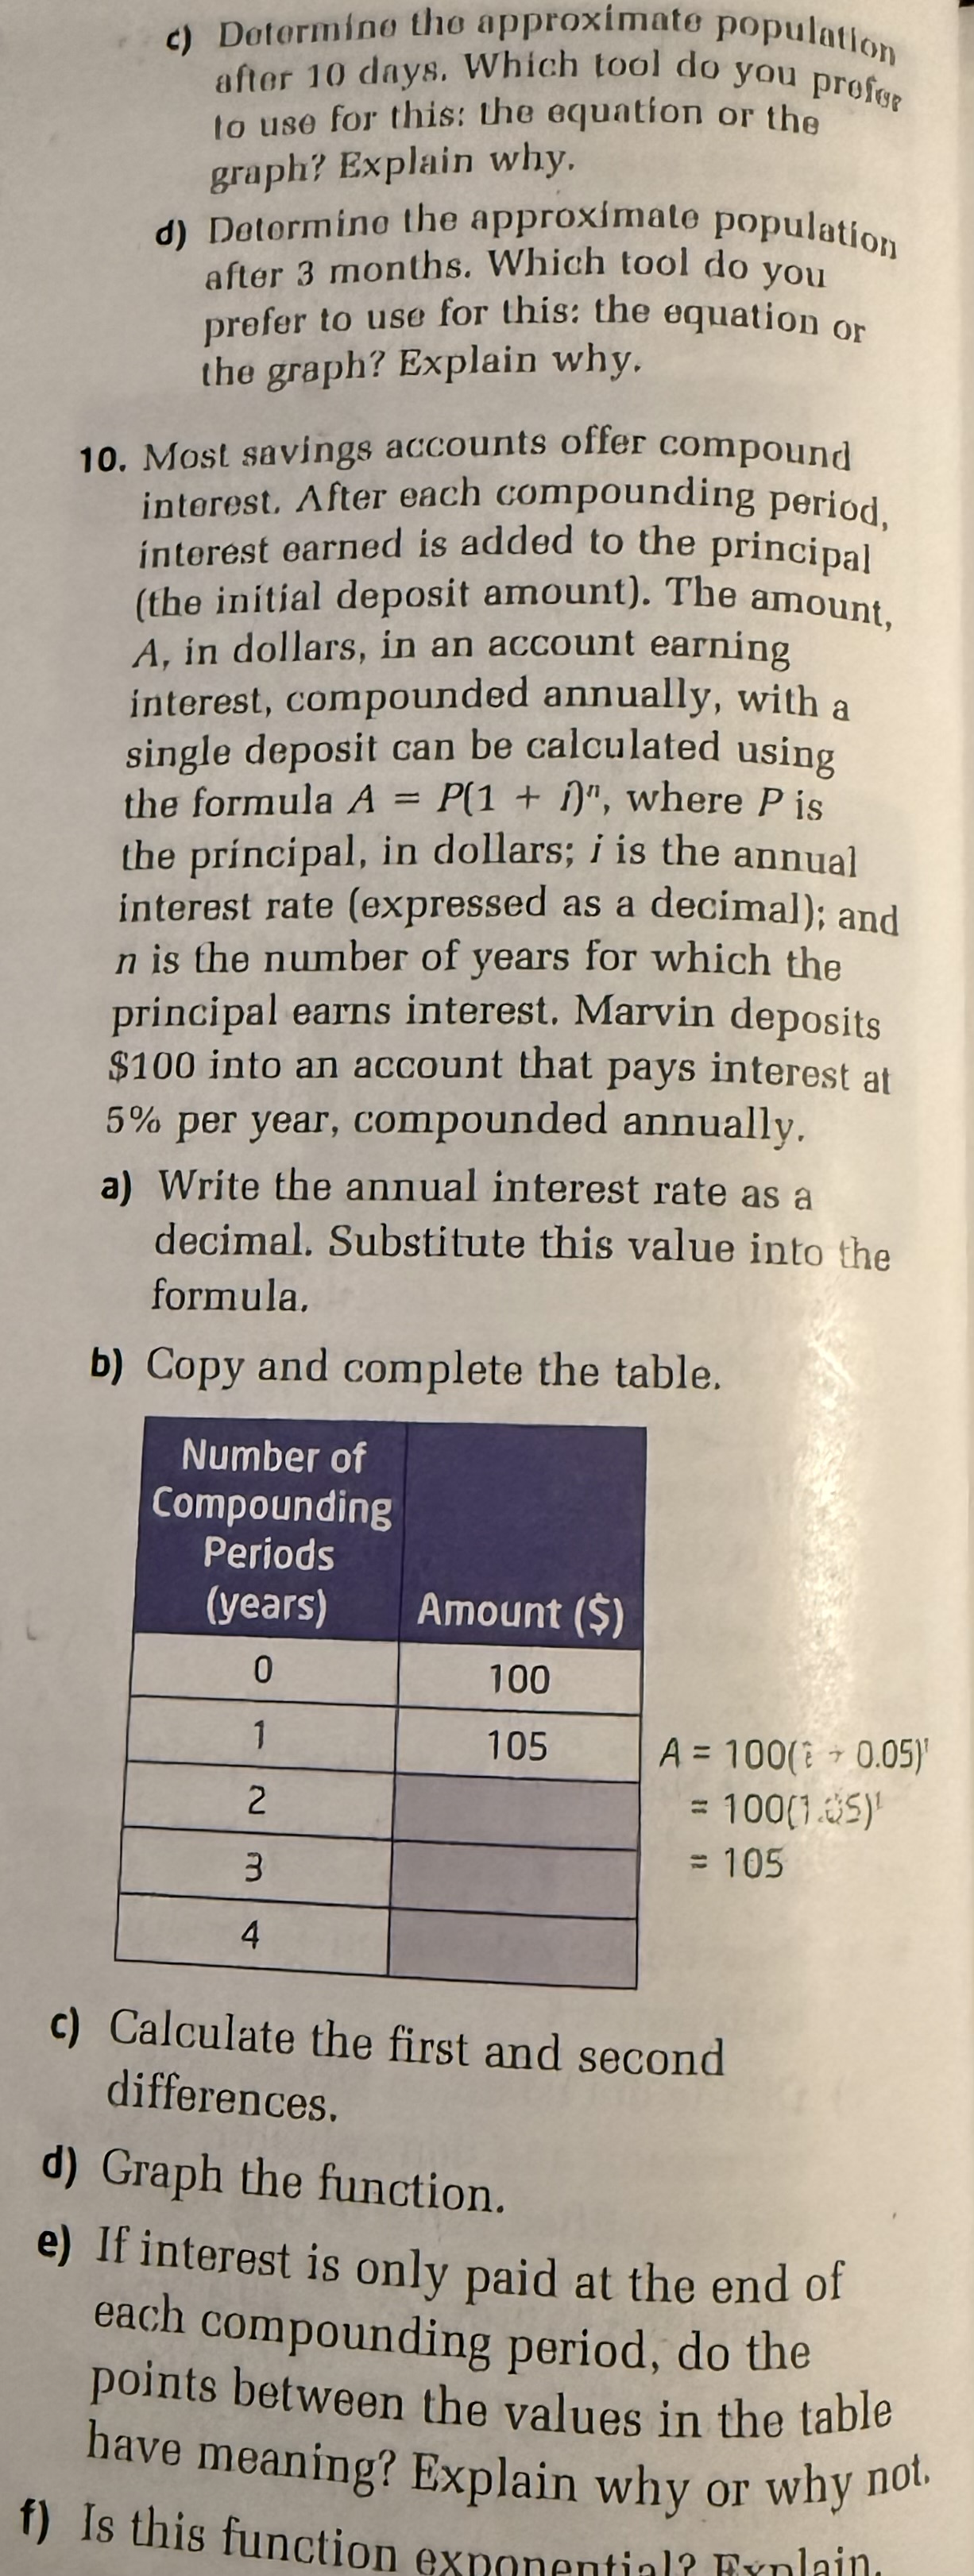
Most savings accounts offer compound interest. After each compounding period, interest earned is added to the principal the initial deposit amount The amount, A in dollars, in an account earning interest, compounded annually, with a single deposit can be calculated using the formula APin where P is the principal, in dollars; i is the annual interest rate expressed as a decimal; and n is the number of years for which the principal earns interest. Marvin deposits $ into an account that pays interest at per year, compounded annually.
a Write the annual interest rate as a decimal. Substitute this value into the formula.
b Copy and complete the table.
beginaligned
A & hati
&
&
endaligned
c Calculate the first and second differences.
d Graph the function.
e If interest is only paid at the end of each compounding period, do the points between the values in the table have meaning? Explain why or why not.
f Is this function exnonentinls Fenlain.
solve all of the parts please
Step by Step Solution
There are 3 Steps involved in it
1 Expert Approved Answer
Step: 1 Unlock

Question Has Been Solved by an Expert!
Get step-by-step solutions from verified subject matter experts
Step: 2 Unlock
Step: 3 Unlock