Question: Math -200 Written Assignment 2 1. Compute the following limits. Show how you found the limits and give justification for your answer. If you are
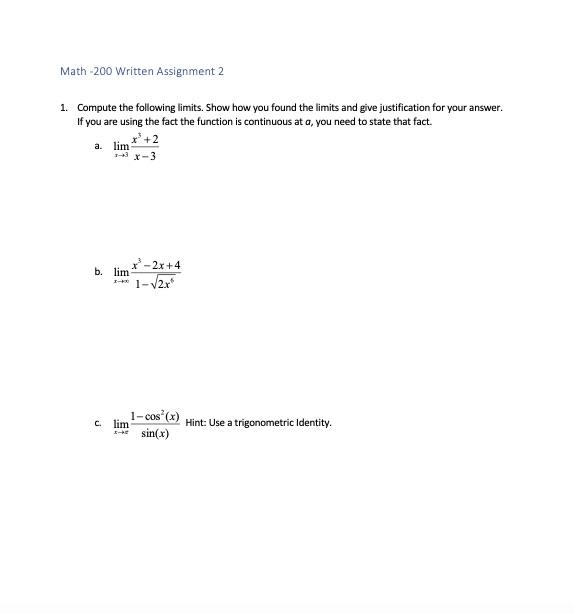
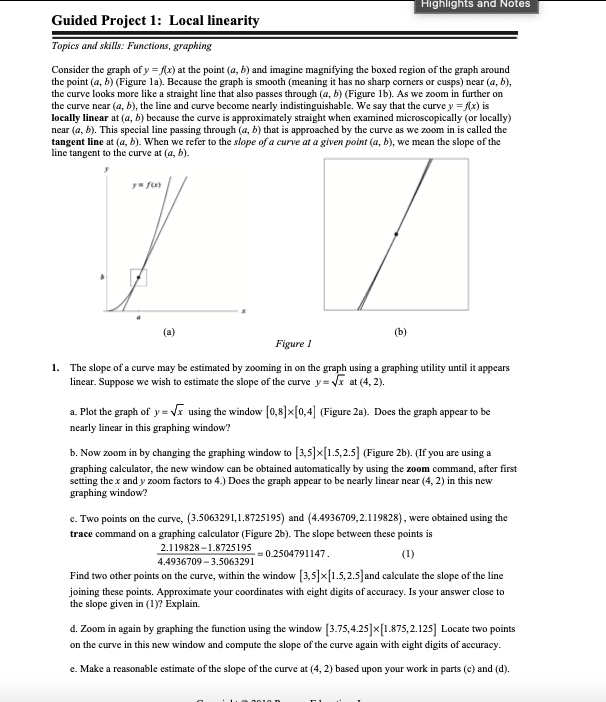
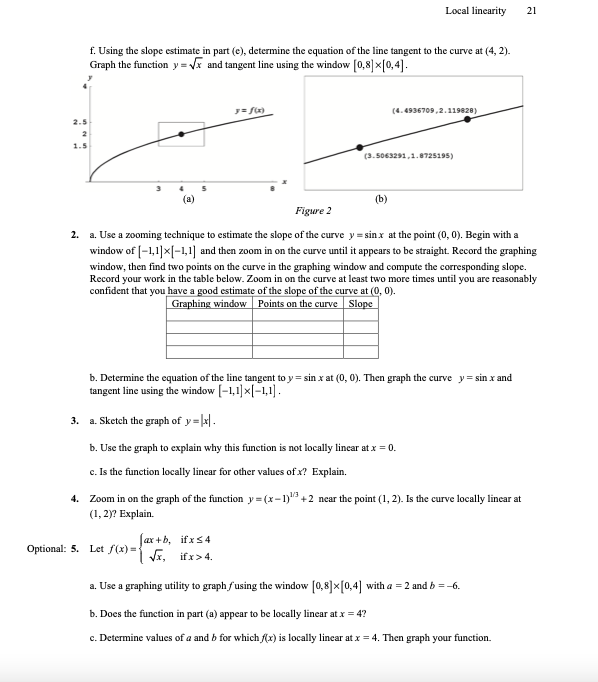
Math -200 Written Assignment 2 1. Compute the following limits. Show how you found the limits and give justification for your answer. If you are using the fact the function is continuous at a, you need to state that fact. a. lim +2 313 x-3 b. lim x -2x+4 1-v2x* C. lim 1-cos (X) Hint: Use a trigonometric Identity. I KE sin(x)2. For this problem, I want you to draw the graph of a function where the limit as x approaches 2 exists, the function is defined at 2, but the function is not continuous. 10 8 -10 -8 -6 -4 -2 2 4 6 8 10Highlights and Notes Guided Project 1: Local linearity Topics and skills: Functions, graphing Consider the graph of y = (x) at the point (a, b) and imagine magnifying the boxed region of the graph around the point (a, b) (Figure la). Because the graph is smooth (meaning it has no sharp corners or cusps) near (a, b), the curve looks more like a straight line that also passes through (a, b) (Figure 1b). As we zoom in further on the curve near (a, b), the line and curve become nearly indistinguishable. We say that the curve y = (x) is locally linear at (a, b) because the curve is approximately straight when examined microscopically (or locally) near (a, b). This special line passing through (a, b) that is approached by the curve as we zoom in is called the tangent line at (a, b). When we refer to the slope of a curve at a given point (a, b), we mean the slope of the line tangent to the curve at (a, b). (a) (b) Figure I 1. The slope of a curve may be estimated by zooming in on the graph using a graphing utility until it appears lincar. Suppose we wish to estimate the slope of the curve y= vx at (4, 2). a. Plot the graph of y= vx using the window [0,8]*[0,4] (Figure 2a). Does the graph appear to be nearly linear in this graphing window? b. Now zoom in by changing the graphing window to [3,5] x[1.5,2.5] (Figure 2b). (If you are using a graphing calculator, the new window can be obtained automatically by using the zoom command, after first setting the x and y zoom factors to 4.) Does the graph appear to be nearly lincar near (4, 2) in this new graphing window? c. Two points on the curve, (3.5063291,1.8725195) and (4.4936709,2.119828), were obtained using the trace command on a graphing calculator (Figure 2b). The slope between these points is 2.1 19828-1.8725195 4.4936709-3.5063291 =0.2504791147. (1) Find two other points on the curve, within the window [3,5] x[1.5,2.5] and calculate the slope of the line joining these points. Approximate your coordinates with eight digits of accuracy. Is your answer close to the slope given in (1)? Explain. d. Zoom in again by graphing the function using the window [3.75,4.25] x [1.875,2.125] Locate two points on the curve in this new window and compute the slope of the curve again with eight digits of accuracy. c. Make a reasonable estimate of the slope of the curve at (4, 2) based upon your work in parts (c) and (d).Local linearity 21 f. Using the slope estimate in part (c), determine the equation of the line tangent to the curve at (4, 2). Graph the function y = wx and tangent line using the window [0,8] x [0,4]. (4.4936709 .2.119828] 3.5 1.5 (3.5063291,1. 8725195) (b) Figure 2 2. a. Use a zooming technique to estimate the slope of the curve y = sinx at the point (0, 0). Begin with a window of [-1,1 x -1,1] and then zoom in on the curve until it appears to be straight. Record the graphing window, then find two points on the curve in the graphing window and compute the corresponding slope. Record your work in the table below. Zoom in on the curve at least two more times until you are reasonably confident that you have a good estimate of the slope of the curve at (0, 0). Graphing window Points on the curve |Slope b. Determine the equation of the line tangent to y = sin x at (0, 0). Then graph the curve y = sin x and tangent line using the window [-1,1] *[-1,1] . 3. a. Sketch the graph of y = x]. b. Use the graph to explain why this function is not locally lincar at x = 0. C. Is the function locally linear for other values of x? Explain. 4. Zoom in on the graph of the function y= (x-1)"* +2 near the point (1, 2). Is the curve locally linear at (1, 2)? Explain. Optional: 5. Let / (x) = artb, ifx54 (x, ifx> 4. a. Use a graphing utility to graph fusing the window [0, 8] x [0,4] with a = 2 and $ =-6. b. Does the function in part (a) appear to be locally linear at x = 4? c. Determine values of a and b for which /(x) is locally lincar at x = 4. Then graph your function
Step by Step Solution
There are 3 Steps involved in it
1 Expert Approved Answer
Step: 1 Unlock
Question Has Been Solved by an Expert!
Get step-by-step solutions from verified subject matter experts
Step: 2 Unlock
Step: 3 Unlock
Students Have Also Explored These Related Mathematics Questions!