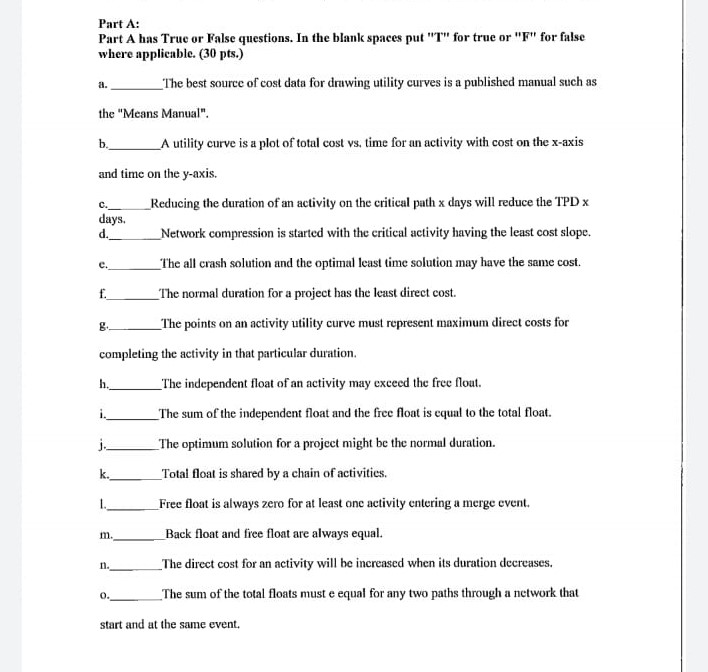
Question: c. e. f. Part A: Part A has True or False questions. In the blank spaces put T for true or F for false where

c. e. f. Part A: Part A has True or False

c. e. f. Part A: Part A has True or False questions. In the blank spaces put "T" for true or "F" for false where applicable. (30 pts.) _The best source of cost data for drawing utility curves is a published manual such as the "Means Manual". b. _A utility curve is a plot of total cost vs, time for an activity with cost on the x-axis and time on the y-axis. _Reducing the duration of an activity on the critical path x days will reduce the TPD X days. d. Network compression is started with the critical activity having the least cost slope. The all crash solution and the optimal least time solution may have the same cost. The normal duration for a project has the least direct cost. 8 _The points on an activity utility curve must represent maximum direct costs for completing the activity in that particular duration. h._ _The independent float of an activity may exceed the free flout. i. The sum of the independent float and the free float is equal to the total float. j The optimum solution for a project might be the normal duration k. _Total float is shared by a chain of activities. 1. Free float is always zero for at least one activity entering a merge event. Back float and free float are always equal. _The direct cost for an activity will be increased when its duration decreases. _The sum of the total floats must e equal for any two paths through a network that start and at the same event. m. n. 0

Step by Step Solution

There are 3 Steps involved in it

1 Expert Approved Answer
Step: 1 Unlock blur-text-image
Question Has Been Solved by an Expert!

Get step-by-step solutions from verified subject matter experts

Step: 2 Unlock
Step: 3 Unlock

Students Have Also Explored These Related General Management Questions!