

Question: . c. Given the following Treasury bond yield information, construct a graph of the yield curve. Using the Treasury yield information in part c, calculate
 .
. 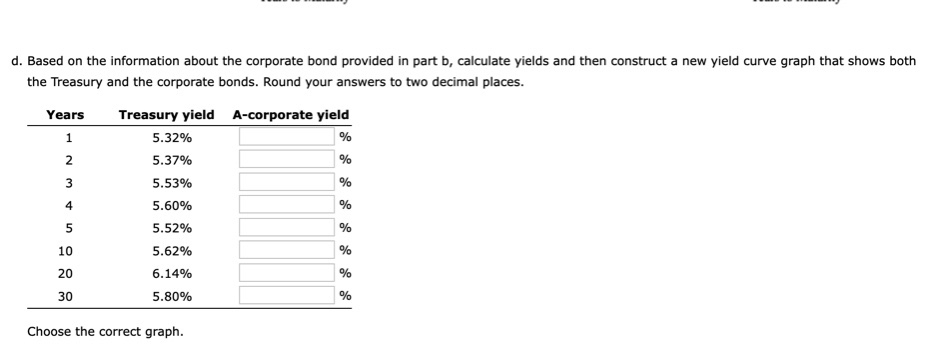
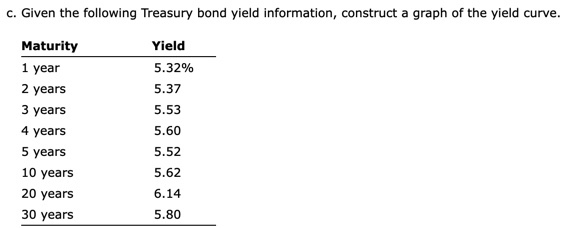
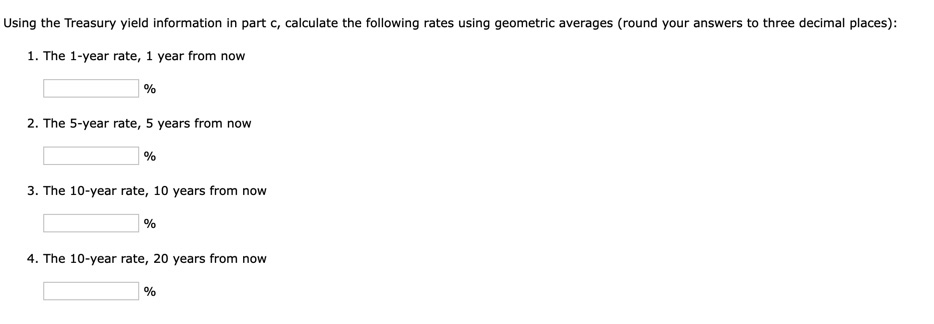
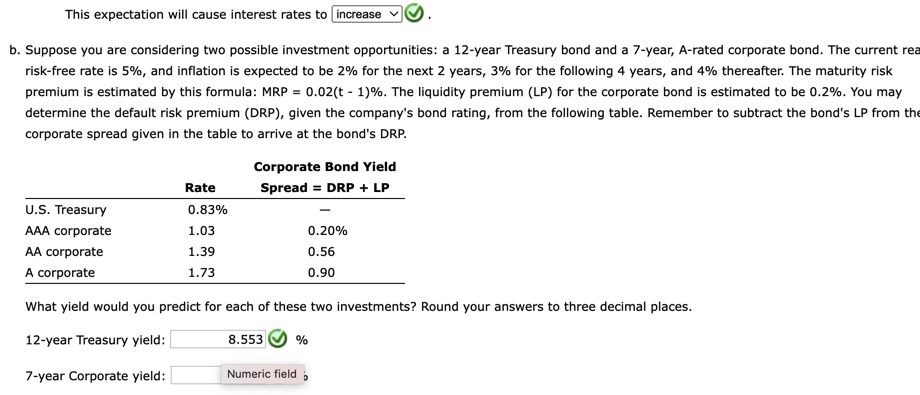
c. Given the following Treasury bond yield information, construct a graph of the yield curve. Using the Treasury yield information in part c, calculate the following rates using geometric averages (round your answers to three decimal places): 1. The 1-year rate, 1 year from now % 2. The 5 -year rate, 5 years from now % 3. The 10 -year rate, 10 years from now % 4. The 10-year rate, 20 years from now % d. Based on the information about the corporate bond provided in part b, calculate yields and then construct a new yield curve graph that shows both the Treasury and the corporate bonds. Round your answers to two decimal places. Choose the correct graph. This expectation will cause interest rates to b. Suppose you are considering two possible investment opportunities: a 12-year Treasury bond and a 7-year, A-rated corporate bond. The current rea risk-free rate is 5%, and inflation is expected to be 2% for the next 2 years, 3% for the following 4 years, and 4% thereafter. The maturity risk premium is estimated by this formula: MRP =0.02(t1)%. The liquidity premium (LP) for the corporate bond is estimated to be 0.2%. You may determine the default risk premium (DRP), given the company's bond rating, from the following table. Remember to subtract the bond's LP from th corporate spread given in the table to arrive at the bond's DRP. What yield would you predict for each of these two investments? Round your answers to three decimal places. 12-year Treasury yield: % 7-year Corporate yield
Step by Step Solution
There are 3 Steps involved in it

Get step-by-step solutions from verified subject matter experts