

Question: C++ I was going to use a nested for loop to separate the numbers that the random number generator will generate. As in the numbers
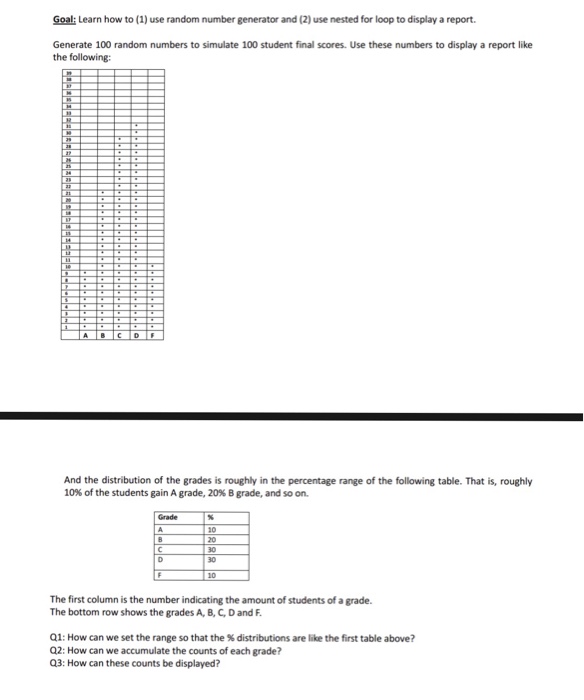
Goal: Learn how to (1) use random number generator and (2) use nested for loop to display a report. Generate 100 random numbers to simulate 100 student final scores. Use these numbers to display a report like the following: And the distribution of the grades is roughly in the percentage range of the following table. That is, roughly 10% of the students gain A grade, 20% B grade, and so on. Grade 20 20 30 The first column is the number indicating the amount of students of a grade. The bottom row shows the grades A, B, C, D and F. Q1: How can we set the range so that the % distributions are like the first table above? a2: How can we accumulate the counts of each grade? 03: How can these counts be displayed
Step by Step Solution
There are 3 Steps involved in it

Get step-by-step solutions from verified subject matter experts