

Question: c ) Now let's use the function you implemented in part ( b ) . Use the two following statements: w h a t 1
c Now let's use the function you implemented in part b Use the two following statements:
escent rain, rain, ateters
escentrain, rain, ateiters
Make note of the arguments. After running these two statements, use matplotlib or seaborn to plot the learning curves of iteration loglosses and loglosses Make two separate plot figures.
Show your code snippet for this part, and the two figures. What is the issue with the first figure, and briefly explain why this issue occurred?
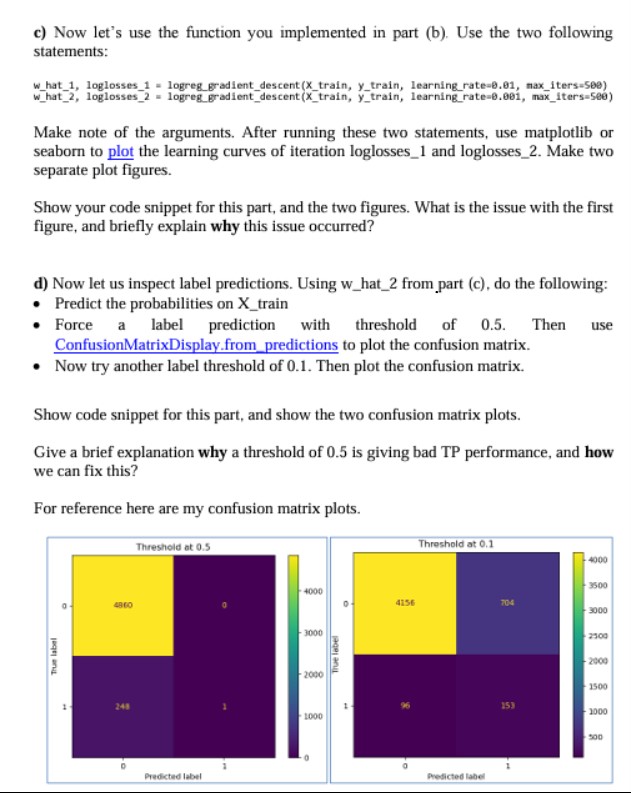
d Now let us inspect label predictions. Using what from part c do the following:
Predict the probabilities on Xtrain
Force a label prediction with threshold of Then use ConfusionMatrixDisplay.frompredictions to plot the confusion matrix.
Now try another label threshold of Then plot the confusion matrix.
Show code snippet for this part, and show the two confusion matrix plots.
Give a brief explanation why a threshold of is giving bad TP performance, and how we can fix this?
For reference here are my confusion matrix plots.
Step by Step Solution
There are 3 Steps involved in it
1 Expert Approved Answer
Step: 1 Unlock

Question Has Been Solved by an Expert!
Get step-by-step solutions from verified subject matter experts
Step: 2 Unlock
Step: 3 Unlock