

Question: C# Please HELP! Student Grade Graph. C# Student Grade Graph by Passing in Command Line Arguments It should display in console as the above examples.
C# Please HELP! Student Grade Graph.
C# Student Grade Graph by Passing in Command Line Arguments
It should display in console as the above examples.
In this assignment, youre going to create a console app for a teacher who has an unknown number of students and needs to display a graph of student grades.
Im not going to tell you how to do the assignment. Weve looked at (in my code samples and projects) many different ways of coding C# Console apps.
This is how youll get the grades into the app. Youre going to pass in grades through the command line separated by spaces. There can be as many grades as the teacher wants to send to the program.
Youll put the grades into the following ranges:
A [90-100], B [80-89], C [70-79], D [60-69] and F [Below 60]
On the Y axis, youll have the number of grades. Figure out which grade has the most and make that the highest value for the Y axis. Youll display a bar graph with asterisks for the graph bars that shows the grade distribution.
The X-axis will be the grades A to F. Youll then tell the user how many of each grade there were.
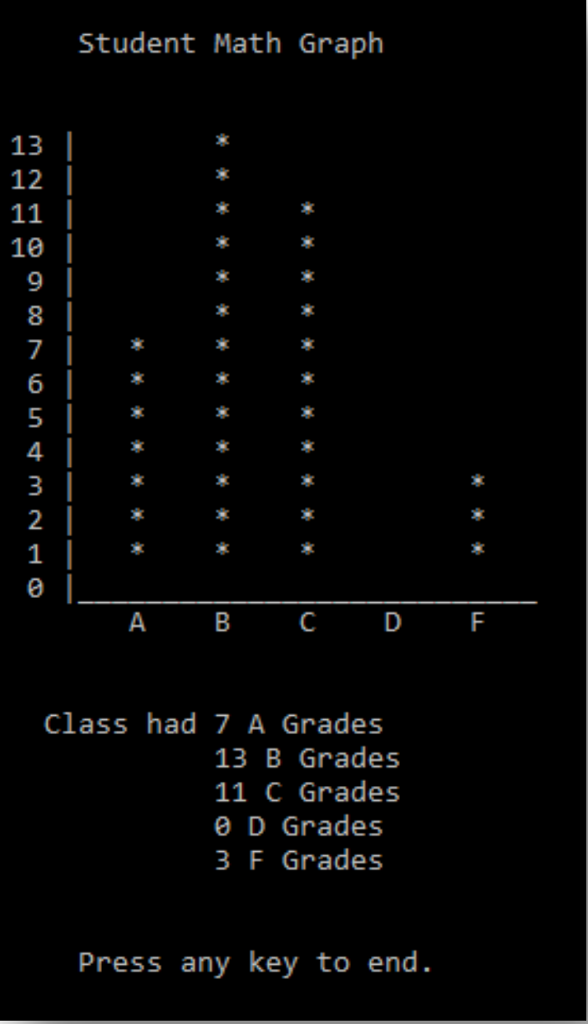
Here is a screen shot of my example using the following values:
83 72 100 49 66 88 84 75 92 96 50 77 93 82 89 99 97 94 86
Youll prompt the user to press the enter key to end the program and exit after displaying their grades.
Assume proper input for the grades and that the user will pass in grades between (and including) 0 and 100.
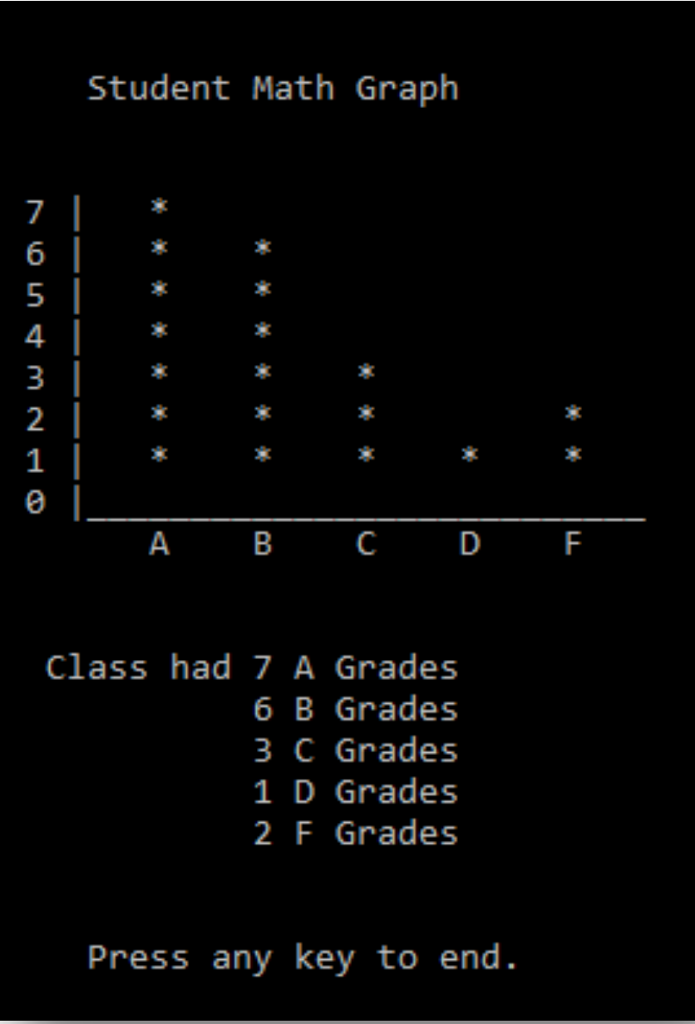
Here is another set of values:
99 55 14 96 70 82 75 83 45 96 74 77 86 84 100 96 86 82 83 84 72 86 85 74 71 90 84 73 77 96 84 84 76 75
To run this project in Visual Studio using the Command Prompt you can right-click on the project
Under debug in the properties you can paste the numbers in the Command Line Arguments box.
Student Math Graph 13 12 11 I 10 9 I 7 I 6 I 5 l 2 I I Class had 7 A Grades 13 B Grades 11 C Grades 0 D Grades 3 F Grades Press any key to end
Step by Step Solution
There are 3 Steps involved in it

Get step-by-step solutions from verified subject matter experts