

Question: C++ Programing APPENDIX A Processing Configuration File Info Upon startup, program should prompt user for the following Please enter config filename: config.txt When user presses
C++ Programing
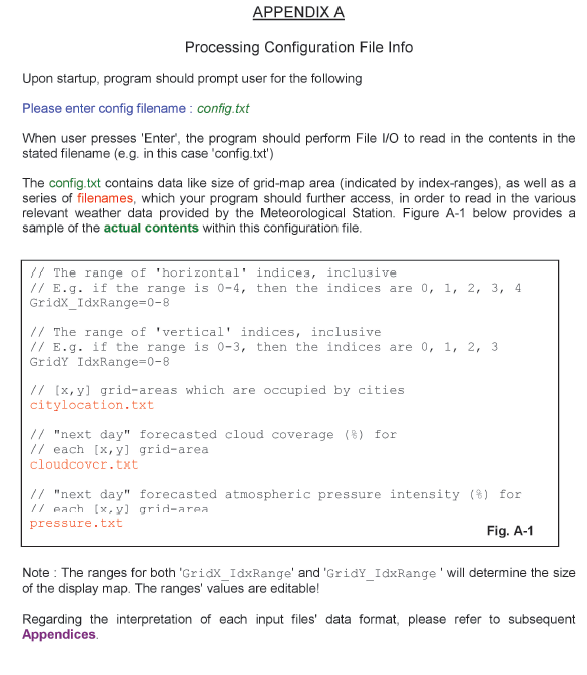
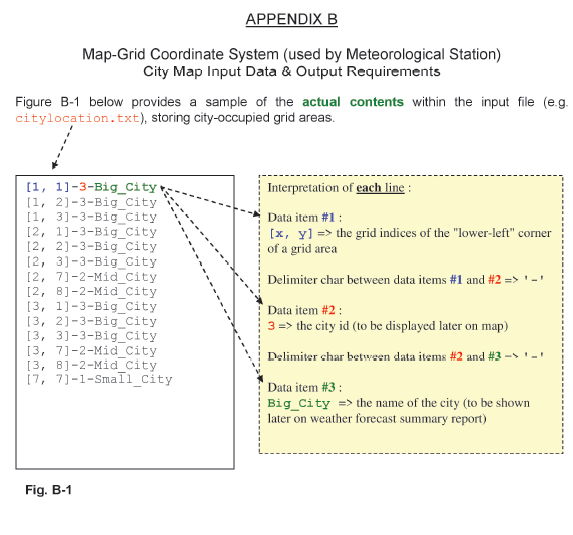

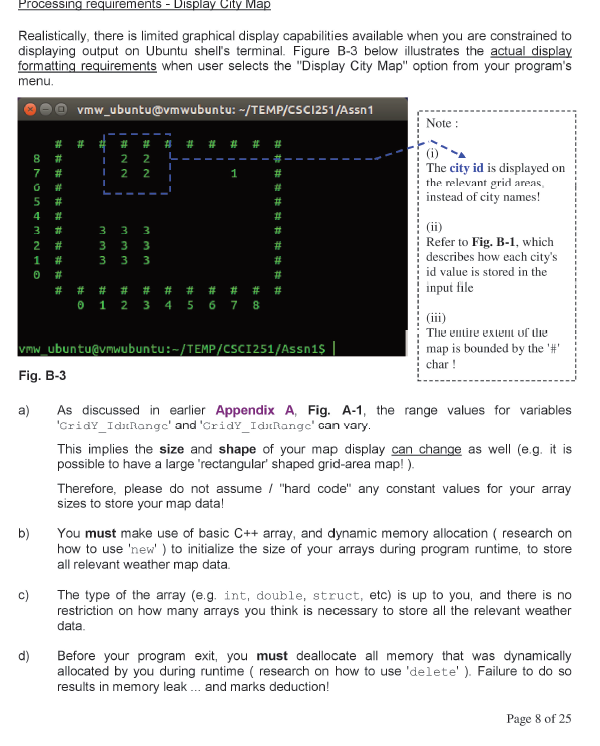
APPENDIX A Processing Configuration File Info Upon startup, program should prompt user for the following Please enter config filename: config.txt When user presses 'Enter', the program should perform File 10 to read in the contents in the stated filename (eg. in this case 'config.txt") The config.txt contains data like size of grid-map area (indicated by index-ranges), as well as a series of filenames, which your program should further access, in order to read in the various relevant weather data provided by the Meteorological Station. Figure A-1 below provides a sample of the actual contents within this configuration file. // The range of 'horizontal' indices, inclusive // E.g. if the range is 0-4, then the indices are 0, 1, 2, 3, 4 GridX_IdxRange=0-8 // The range of 'vertical' indices, inclusive // E.g. if the range is 0-3, then the indices are 0, 1, 2, 3 Gridy IdxRange=0-8 // {x,y] grid-areas which are occupied by cities citylocation.txt // "next day" forecasted cloud coverage (8) for // each (x,y) grid-area cloudcovcr.txt // "next day" forecasted atmospheric pressure intensity (8) for // each (x,y) grid-area pressure.txt Fig. A-1 Note : The ranges for both 'Gridx_IdxRange' and 'Gridy_IdxRange' will determine the size of the display map. The ranges' values are editable! Regarding the interpretation of each input files' data format, please refer to subsequent Appendices. APPENDIX B Map-Grid Coordinate System (used by Meteorological Station) City Map Input Data & Output Requirements Figure B-1 below provides a sample of the actual contents within the input file (eg. citylocation.txt), storing city-occupied grid areas. Interpretation of each line : Data item #1 : [x, y] => the grid indices of the "lower-left" corner of a grid area [1, 1] -3-Big_City [1, 2]-3-Big_City [1, 3)-3-Big_City [2, 1]-3-Big_City [2, 2)-3-Big_City [2, 3]-3-Big_City [2, 71-2-Mid_City [2, 3] -2-Mid_City [3, 1)-3-Big_City [3, 2)-3-Big_City [3, 3)-3-Big_city [3, 7)-2-Mid_City [3, 8] -2-Mid City 17, 7]-1-Small_City Delimiter char between data items #1 and #2 => '-' Data item #2: 3 => the city id to be displayed later on map) Delimiter char between slata items #2 and #3 - - Data item #3 : Big_City => the name of the city (to be shown later on weather forecast summary report) Fig. B-1 2- To aid in the visualization and understanding of how the city location input data will look like, in a 2D graphical format, please refer to the figure B-2 below. Student's INPUT Daan graphical form) Laulo (x, y] iraul in from die input file (see earlier Fig. Highlighted in Bright Yellow ]-Grid Area(s) occupied by each city B-1) describes the indices I Highlighted in Light Yellow 1-Grid Areals) sumounding each city of the LOWER LEFT corner of a grid area Mid_City Mid_Cry E.g. 13, 8] refers to the MdC Mid Cry Lower Left corner of this grid area [0,0] origin refers to the Lower Left corner of this grid area 8 7 2- 1- Small CI ty 6 5 3 3- 3- BigCity Big_Cky Big_City 3- 3- Big City Big_City Big City Tlie range ul luizontal) indices to be shown on the map ranges from 0-8 (inclusive) 2 3- 3- Big_City Big_Cky Big_Chy 1 2 3 4 5 6 7 8 This info is retrieved from the value stored in the configuration file (see Appendix A. Fig. A-1), assigned to the variable 'Gridx_IdxRangel Fig. B-2 The same treatment applies for the variable 'GridY_IdxRange', for the range of vertical indices Note : a) Bright Yellow grid areas indicate the ACTUAL Grid Area occupied by a particular city. For example, in the fig. B-2 above, the city named "Mid_City" occupies the following grid areas : [2.7], [2, 8], [3, 7], [3, 8] b) Light Yellow grid areas indicate the grid areas surrounding the perimeter of EACH city. For example, in fig. B-2 above, the city named "Mid_City" has the following grid areas surrounding its perimeter : [1,6],[1, 7],[1, 8], [2,6], [3,6], [4,6], [4,7], [4, 8] The grid areas (1,9), [2,9), (3,9), [4,9) are not shown as they are BEYOND the upper limits of the vertical Gridy_IdxRange! Page 7 of 2 Processing requirements - Display City Map Realistically, there is limited graphical display capabilities available when you are constrained to displaying output on Ubuntu shell's terminal. Figure B-3 below illustrates the actual display formatting requirements when user selects the "Display City Map" option from your program's menu. vmw_ubuntu@mwubuntu: -/TEMP/CSC1251/Assn 1 Note : # # # # 2 2 2 2 1 # # T The city id is displayed on the relevant grid areas, instead of city names! 5 4 3 2 1 # # # # 33 #### Refer to Fig. B-1, which describes how each city's id value is stored in the input file # # # # # # # # # 0 1 2 3 4 5 6 7 8 vmw_ubuntu@mwubuntu:-/TEMP/CSCI251/Assnis | Fig. B-3 The entire extent of the map is bounded by the '#' char! a) As discussed in earlier Appendix A. Fig. A-1, the range values for variables 'GridY_IdatRange' and 'CridY_Ida Range' can vary. This implies the size and shape of your map display can change as well (eg. it is possible to have a large 'rectangular' shaped grid-area map!). Therefore, please do not assume / "hard code" any constant values for your array sizes to store your map data! You must make use of basic C++ array, and dynamic memory allocation ( research on how to use 'new' ) to initialize the size of your arrays during program runtime, to store all relevant weather map data. The type of the array (e.g, int, double, struct, etc) is up to you, and there is no restriction on how many arrays you think is necessary to store all the relevant weather data b) c) d) Before your program exit, you must deallocate all memory that was dynamically allocated by you during runtime research on how to use 'delete'). Failure to do so results in memory leak ... and marks deduction! Page 8 of 25 APPENDIX A Processing Configuration File Info Upon startup, program should prompt user for the following Please enter config filename: config.txt When user presses 'Enter', the program should perform File 10 to read in the contents in the stated filename (eg. in this case 'config.txt") The config.txt contains data like size of grid-map area (indicated by index-ranges), as well as a series of filenames, which your program should further access, in order to read in the various relevant weather data provided by the Meteorological Station. Figure A-1 below provides a sample of the actual contents within this configuration file. // The range of 'horizontal' indices, inclusive // E.g. if the range is 0-4, then the indices are 0, 1, 2, 3, 4 GridX_IdxRange=0-8 // The range of 'vertical' indices, inclusive // E.g. if the range is 0-3, then the indices are 0, 1, 2, 3 Gridy IdxRange=0-8 // {x,y] grid-areas which are occupied by cities citylocation.txt // "next day" forecasted cloud coverage (8) for // each (x,y) grid-area cloudcovcr.txt // "next day" forecasted atmospheric pressure intensity (8) for // each (x,y) grid-area pressure.txt Fig. A-1 Note : The ranges for both 'Gridx_IdxRange' and 'Gridy_IdxRange' will determine the size of the display map. The ranges' values are editable! Regarding the interpretation of each input files' data format, please refer to subsequent Appendices. APPENDIX B Map-Grid Coordinate System (used by Meteorological Station) City Map Input Data & Output Requirements Figure B-1 below provides a sample of the actual contents within the input file (eg. citylocation.txt), storing city-occupied grid areas. Interpretation of each line : Data item #1 : [x, y] => the grid indices of the "lower-left" corner of a grid area [1, 1] -3-Big_City [1, 2]-3-Big_City [1, 3)-3-Big_City [2, 1]-3-Big_City [2, 2)-3-Big_City [2, 3]-3-Big_City [2, 71-2-Mid_City [2, 3] -2-Mid_City [3, 1)-3-Big_City [3, 2)-3-Big_City [3, 3)-3-Big_city [3, 7)-2-Mid_City [3, 8] -2-Mid City 17, 7]-1-Small_City Delimiter char between data items #1 and #2 => '-' Data item #2: 3 => the city id to be displayed later on map) Delimiter char between slata items #2 and #3 - - Data item #3 : Big_City => the name of the city (to be shown later on weather forecast summary report) Fig. B-1 2- To aid in the visualization and understanding of how the city location input data will look like, in a 2D graphical format, please refer to the figure B-2 below. Student's INPUT Daan graphical form) Laulo (x, y] iraul in from die input file (see earlier Fig. Highlighted in Bright Yellow ]-Grid Area(s) occupied by each city B-1) describes the indices I Highlighted in Light Yellow 1-Grid Areals) sumounding each city of the LOWER LEFT corner of a grid area Mid_City Mid_Cry E.g. 13, 8] refers to the MdC Mid Cry Lower Left corner of this grid area [0,0] origin refers to the Lower Left corner of this grid area 8 7 2- 1- Small CI ty 6 5 3 3- 3- BigCity Big_Cky Big_City 3- 3- Big City Big_City Big City Tlie range ul luizontal) indices to be shown on the map ranges from 0-8 (inclusive) 2 3- 3- Big_City Big_Cky Big_Chy 1 2 3 4 5 6 7 8 This info is retrieved from the value stored in the configuration file (see Appendix A. Fig. A-1), assigned to the variable 'Gridx_IdxRangel Fig. B-2 The same treatment applies for the variable 'GridY_IdxRange', for the range of vertical indices Note : a) Bright Yellow grid areas indicate the ACTUAL Grid Area occupied by a particular city. For example, in the fig. B-2 above, the city named "Mid_City" occupies the following grid areas : [2.7], [2, 8], [3, 7], [3, 8] b) Light Yellow grid areas indicate the grid areas surrounding the perimeter of EACH city. For example, in fig. B-2 above, the city named "Mid_City" has the following grid areas surrounding its perimeter : [1,6],[1, 7],[1, 8], [2,6], [3,6], [4,6], [4,7], [4, 8] The grid areas (1,9), [2,9), (3,9), [4,9) are not shown as they are BEYOND the upper limits of the vertical Gridy_IdxRange! Page 7 of 2 Processing requirements - Display City Map Realistically, there is limited graphical display capabilities available when you are constrained to displaying output on Ubuntu shell's terminal. Figure B-3 below illustrates the actual display formatting requirements when user selects the "Display City Map" option from your program's menu. vmw_ubuntu@mwubuntu: -/TEMP/CSC1251/Assn 1 Note : # # # # 2 2 2 2 1 # # T The city id is displayed on the relevant grid areas, instead of city names! 5 4 3 2 1 # # # # 33 #### Refer to Fig. B-1, which describes how each city's id value is stored in the input file # # # # # # # # # 0 1 2 3 4 5 6 7 8 vmw_ubuntu@mwubuntu:-/TEMP/CSCI251/Assnis | Fig. B-3 The entire extent of the map is bounded by the '#' char! a) As discussed in earlier Appendix A. Fig. A-1, the range values for variables 'GridY_IdatRange' and 'CridY_Ida Range' can vary. This implies the size and shape of your map display can change as well (eg. it is possible to have a large 'rectangular' shaped grid-area map!). Therefore, please do not assume / "hard code" any constant values for your array sizes to store your map data! You must make use of basic C++ array, and dynamic memory allocation ( research on how to use 'new' ) to initialize the size of your arrays during program runtime, to store all relevant weather map data. The type of the array (e.g, int, double, struct, etc) is up to you, and there is no restriction on how many arrays you think is necessary to store all the relevant weather data b) c) d) Before your program exit, you must deallocate all memory that was dynamically allocated by you during runtime research on how to use 'delete'). Failure to do so results in memory leak ... and marks deduction! Page 8 of 25
Step by Step Solution
There are 3 Steps involved in it

Get step-by-step solutions from verified subject matter experts