

Question: c. Use the data for all 45 weeks to develop the new control charts. Develop an X-chart. Choose the correct graph below. A. Mean
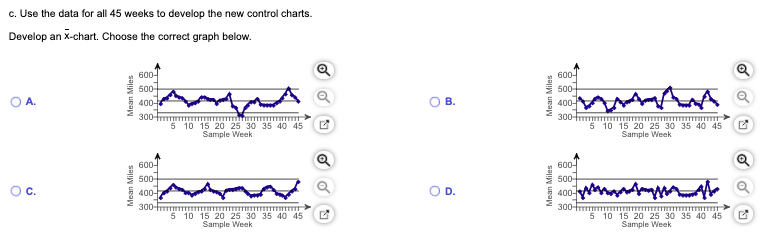
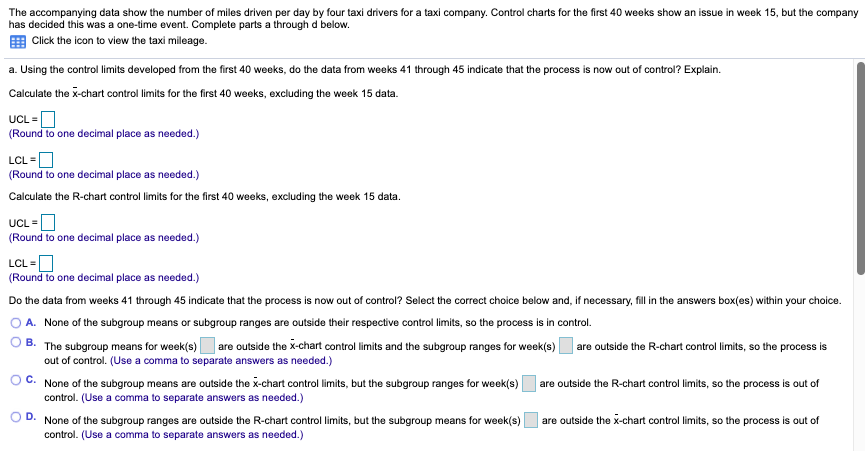
c. Use the data for all 45 weeks to develop the new control charts. Develop an X-chart. Choose the correct graph below. A. Mean Miles 600- 500 400- 300 600- 500- 400- 300- 5 10 15 20 25 30 35 40 45 Sample Week 5 10 15 20 25 30 35 40 45 Sample Week D. B. Mean Miles 600- 500- 400- 300- MAMAA 5 10 15 20 25 30 35 40 45 Sample Week Q 600 500- 400-1 300-mm 5 10 15 20 25 30 35 40 45 Sample Week The accompanying data show the number of miles driven per day by four taxi drivers for a taxi company. Control charts for the first 40 weeks show an issue in week 15, but the company has decided this was a one-time event. Complete parts a through d below. Click the icon to view the taxi mileage. a. Using the control limits developed from the first 40 weeks, do the data from weeks 41 through 45 indicate that the process is now out of control? Explain. Calculate the x-chart control limits for the first 40 weeks, excluding the week 15 data. UCL = (Round to one decimal place as needed.) LCL (Round to one decimal place as needed.) Calculate the R-chart control limits for the first 40 weeks, excluding the week 15 data. UCL = (Round to one decimal place as needed.) LCL = (Round to one decimal place as needed.) Do the data from weeks 41 through 45 indicate that the process is now out of control? Select the correct choice below and, if necessary, fill in the answers box(es) within your choice. A. None of the subgroup means or subgroup ranges are outside their respective control limits, so the process is in control. B. The subgroup means for week(s) are outside the x-chart control limits and the subgroup ranges for week(s) are outside the R-chart control limits, so the process is out of control. (Use a comma to separate answers as needed.) None of the subgroup means are outside the x-chart control limits, but the subgroup ranges for week(s) control. (Use a comma to separate answers as needed.) D. None of the subgroup ranges are outside the R-chart control limits, but the subgroup means for week(s) control. (Use a comma to separate answers as needed.) are outside the R-chart control limits, so the process is out of are outside the x-chart control limits, so the process is out of
Step by Step Solution
There are 3 Steps involved in it

Get step-by-step solutions from verified subject matter experts