

Question: c) USING MATLAB, generate a table of the Pareto data b) USING MATLAB, plot a full Pareto chart , showing the number of hull loss
c) USING MATLAB, generate a table of the Pareto data
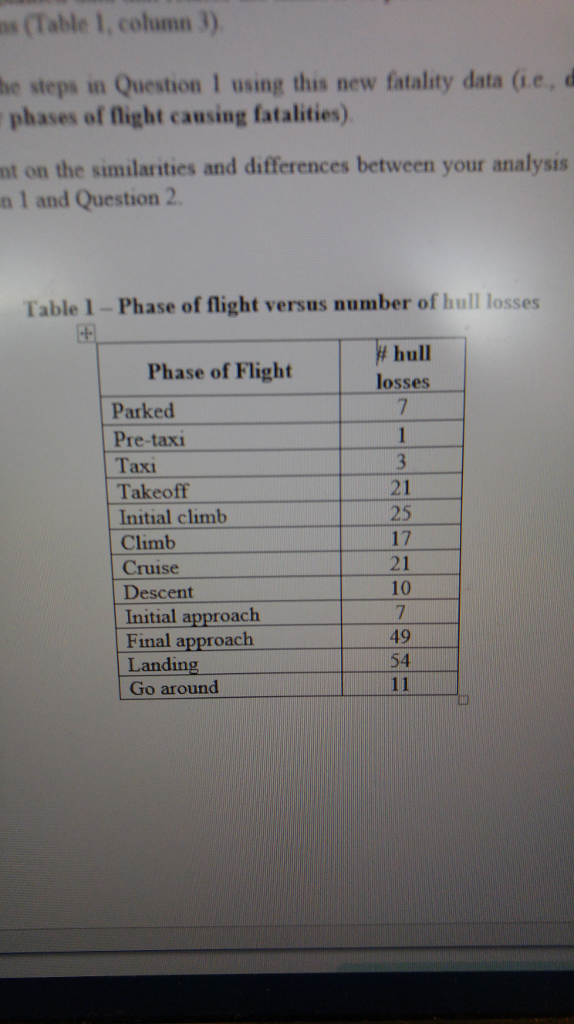
b) USING MATLAB, plot a full Pareto chart, showing the number of hull loss accidents on the left y-axis (with histogram) and the cumulative probability axis on the right y-axis (with line).
data for pareto analysis:
 please provide matlab code in solution for both of the questions
Step by Step Solution
There are 3 Steps involved in it
1 Expert Approved Answer
Step: 1 Unlock

Question Has Been Solved by an Expert!
Get step-by-step solutions from verified subject matter experts
Step: 2 Unlock
Step: 3 Unlock