

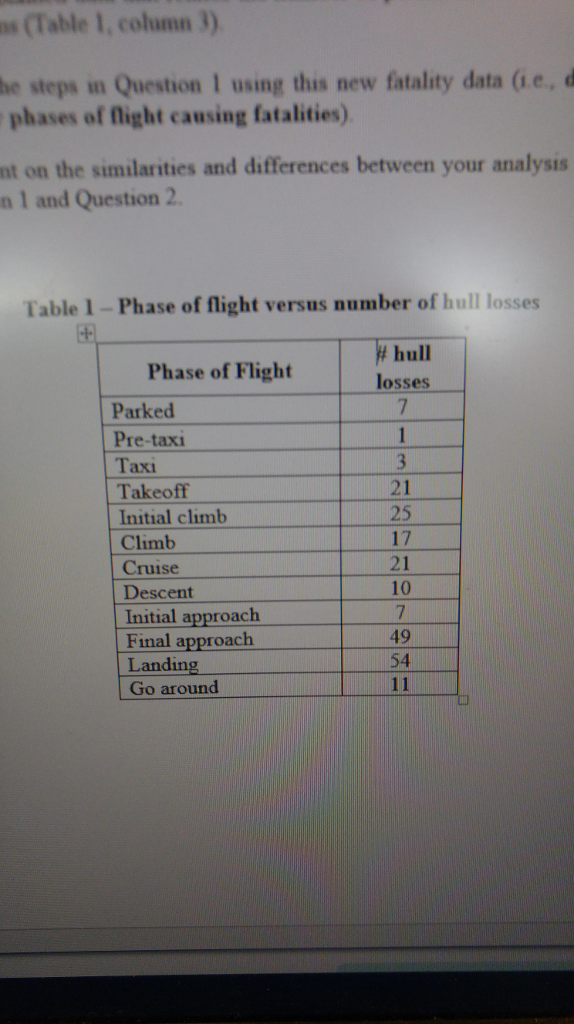
Question: USING MATLAB, plot a full Pareto chart, showing the number of hull loss accidents on the left y-axis (with histogram) and the cumulative probability axis
USING MATLAB, plot a full Pareto chart, showing the number of hull loss accidents on the left y-axis (with histogram) and the cumulative probability axis on the right y-axis (with line). Do not use pareto command function in matlab but calculate it manually though matlab.
Step by Step Solution
There are 3 Steps involved in it
1 Expert Approved Answer
Step: 1 Unlock

Question Has Been Solved by an Expert!
Get step-by-step solutions from verified subject matter experts
Step: 2 Unlock
Step: 3 Unlock