

Question: c . Using simple linear regression, calculate the trend line for the historical data. Say the x axis is April = 1 , May =
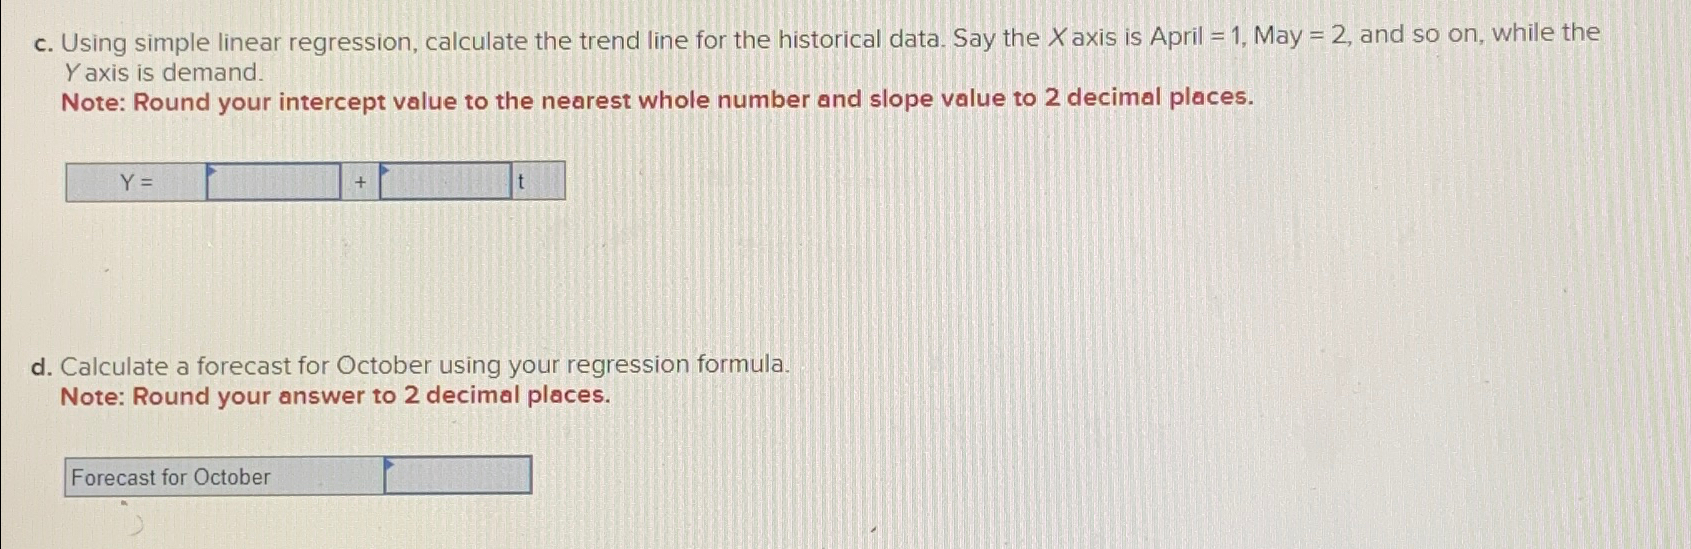
c Using simple linear regression, calculate the trend line for the historical data. Say the axis is April May and so on while the axis is demand.
Note: Round your intercept value to the nearest whole number and slope value to decimal places.
d Calculate a forecast for October using your regression formula.
Note: Round your answer to decimal places.
Forecast for October
Step by Step Solution
There are 3 Steps involved in it
1 Expert Approved Answer
Step: 1 Unlock

Question Has Been Solved by an Expert!
Get step-by-step solutions from verified subject matter experts
Step: 2 Unlock
Step: 3 Unlock