Question: (c) Using the data in the following table, you are responsible for developing a marketing program for India and Brazil. Use the data for the
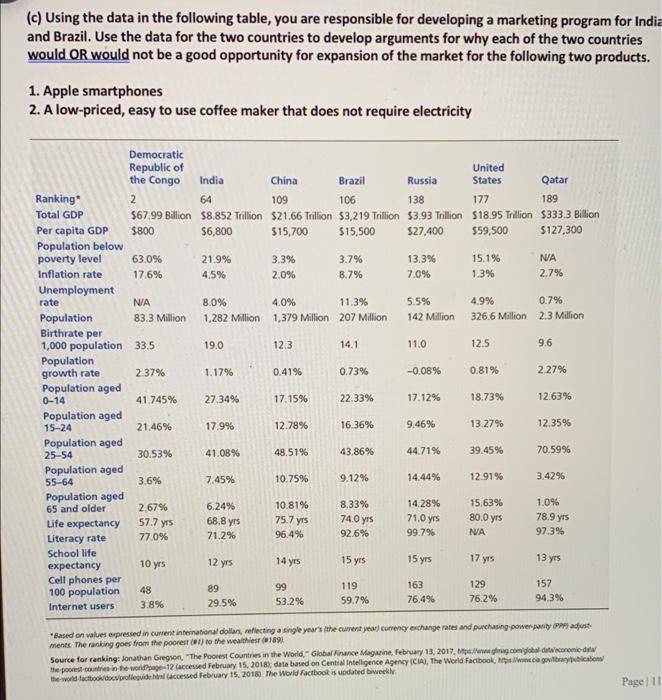
(c) Using the data in the following table, you are responsible for developing a marketing program for India and Brazil. Use the data for the two countries to develop arguments for why each of the two countries would OR would not be a good opportunity for expansion of the market for the following two products. 1. Apple smartphones 2. A low-priced, easy to use coffee maker that does not require electricity Ranking* Total GDP Per capita GDP Population below poverty level Inflation rate Unemployment rate Population growth rate Population aged 0-14 Population aged 15-24 Population aged 25-54 Population Birthrate per 1,000 population 33.5 Population aged 55-64 Democratic Republic of the Congo 2 Population aged 65 and older Life expectancy Literacy rate School life expectancy Cell phones per 100 population Internet users India Brazil China 109 Russia 138 64 106 $67.99 Billion $8,852 Trillion $21.66 Trillion $3,219 Trillion $3.93 Trillion $800 $6,800 $15,700 $15,500 $27,400 63.0% 17.6% N/A 83.3 Million 2.37% 41.745% 21.46% 30.53% 3.6% 2,67% 57.7 yrs 77.0% 10 yrs 48 3.8% 21.9% 4.5% 8.0% 1,282 Million 19.0 1.17% 27,34% 17.9% 41.08% 7.45% 6.24% 68.8 yrs 71,2% 12 yrs 89 29.5% 3.3% 2.0% 4.0% 11.3% 1,379 Million 207 Million 12.3 0.41% 17.15% 12.78% 48.51% 10.75% 10.81% 75.7 yrs 96.4% 14 yrs 3.7% 8.7% 99 53.2% 14.1 0.73% 22.33% 16.36% 43.86% 9.12% 8.33% 74.0 yrs 92.6% 15 yrs 119 59.7% 13.3% 7.0% 5.5% 142 Million 11.0 -0.08% 17.12% 9.46% 44.71% 14.44% 14.28% 71.0 yrs 99.7% 15 yrs 163 76.4% United States Qatar 177 189 $18.95 Trillion $333.3 Billion $59,500 $127,300 15.1% 1.3% 4.9% 326.6 Million 12.5 0.81% 18.73% 13.27% 39.45% 12.91% 15.63% 80.0 yrs 17 yrs 129 76.2% N/A 2.7% 0.7% 2.3 Million 9.6 2.27% 12.63% 12.35% 70.59% 3.42% 1.0% 78.9 yrs 97.3% 13 yrs 157 94.3% *Based on values expressed in current international dollars, reflecting a single year's (the current year) currency exchange rates and purchasing power party (PPP) adjust ments. The ranking goes fro the poorest (1) to the wealthiest (189) Source for ranking: Jonathan Gregson, "The Poorest Countries in the World," Global Finance Magazine, February 13, 2017, bp/ew gmag.com/global data economic data the poorest-countries in the world?page-12 (accessed February 15, 2018); data based on Central Intelligence Agency (CIA), The World Factbook, pw.cia.gov/library/publications the world-factbook/docs/profleguide hand (accessed February 15, 2018) The World Factbook is updated biweekly Page 11