Question: Q3: What does the five forces model look like for TATA in the global automotive market? (About 300 -400 words) Degree of competition in the
Q3: What does the five forces model look like for TATA in the global automotive market? (About 300 -400 words)
- Degree of competition in the industry: High/Low (Strength of the force)
Supporting Arguments:
-
-
- Threat of new entrants: High/Low (Strength of the force)
Supporting Arguments:
-
-
- Bargaining power of buyers: High/Low (Strength of the force)
Supporting Arguments:
-
-
- Bargaining power of suppliers: High/Low (Strength of the force)
Supporting Arguments:
-
-
- Threat of substitutes: High/Low (Strength of the force)
Supporting Arguments:
-
-
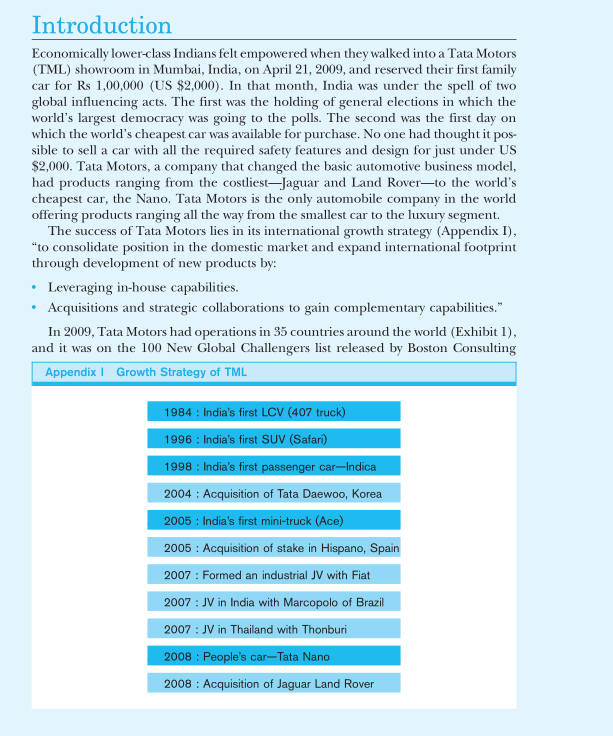
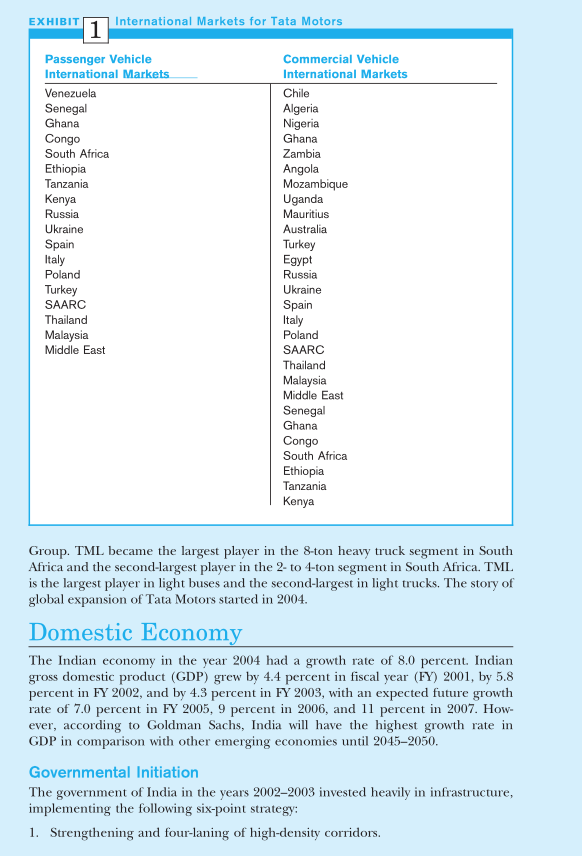
Introduction Economically lower-class Indians felt empowered when they walked into a Tata Motors (TML) showroom in Mumbai, India, on April 21, 2009, and reserved their first family car for Rs 1,00,000 (US $2,000). In that month, India was under the spell of two global influencing acts. The first was the holding of general elections in which the world's largest democracy was going to the polls. The second was the first day on which the world's cheapest car was available for purchase. No one had thought it pos- sible to sell a car with all the required safety features and design for just under US $2,000. Tata Motors, a company that changed the basic automotive business model, had products ranging from the costliestJaguar and Land Roverto the world's cheapest car, the Nano. Tata Motors is the only automobile company in the world offering products ranging all the way from the smallest car to the luxury segment. The success of Tata Motors lies in its international growth strategy (Appendix I), "to consolidate position in the domestic market and expand international footprint through development of new products by: Leveraging in-house capabilities. Acquisitions and strategic collaborations to gain complementary capabilities." In 2009, Tata Motors had operations in 35 countries around the world (Exhibit 1), and it was on the 100 New Global Challengers list released by Boston Consulting Appendix ! Growth Strategy of TML 1984 : India's first LCV (407 truck) 1996 : India's first SUV (Safari) 1998 : India's first passenger car-Indica 2004 : Acquisition of Tata Daewoo, Korea 2005 : India's first mini-truck (Ace) 2005 : Acquisition of stake in Hispano, Spain 2007 : Formed an industrial JV with Fiat 2007 : JV in India with Marcopolo of Brazil 2007 : JV in Thailand with Thonburi 2008 : People's car-Tata Nano 2008 : Acquisition of Jaguar Land Rover EXHIBIT 1 | International Markets for Tata Motors Passenger Vehicle Commercial Vehicle International Markets International Markets Venezuela Chile Senegal Algeria Ghana Nigeria Congo Ghana South Africa Zambia Ethiopia Angola Tanzania Mozambique Kenya Uganda Russia Mauritius Ukraine Australia Spain Turkey Italy Egypt Poland Russia Turkey Ukraine SAARC Spain Thailand Italy Malaysia Poland Middle East SAARC Thailand Malaysia Middle East Senegal Ghana Congo South Africa Ethiopia Tanzania Kenya Group. TML became the largest player in the 8-ton heavy truck segment in South Africa and the second-largest player in the 2- to 4-ton segment in South Africa. TML is the largest player in light buses and the second-largest in light trucks. The story of global expansion of Tata Motors started in 2004. Domestic Economy The Indian economy in the year 2004 had a growth rate of 8.0 percent. Indian gross domestic product (GDP) grew by 4.4 percent in fiscal year (FY) 2001, by 5.8 percent in FY 2002, and by 4.3 percent in FY 2003, with an expected future growth rate of 7.0 percent in FY 2005, 9 percent in 2006, and 11 percent in 2007. How- ever, according to Goldman Sachs, India will have the highest growth rate in GDP in comparison with other emerging economies until 20452050. Governmental Initiation The government of India in the years 20022003 invested heavily in infrastructure, implementing the following six-point strategy: 1. Strengthening and four-laning of high-density corridors. 2. Golden Quadrilateral (5,846 kilometers). 3. NSEW Corridor (7,300 kilometers). 4. Road connectivity to major ports. 5. Private sector participation in financing construction and maintenance. 6. Improvement, maintenance, and augmentation of the existing national high- ways network. This investment was expected to enhance commercial vehicle penetration in India. Furthermore, in 2008, India became the: Second-largest two-wheeler market in the world. Fourth-largest commercial vehicle market in the world. Eleventh-largest passenger car market in the world and is expected to be the seventh-largest market by 2016. . Demographic Shift in India It was expected that by 2009, 60 percent of India's population would be 25 years of age and less. The consumption of food and beverage, which was 62.5 percent in the years 19701971, came down to 44.5 percent in 2001 and was trending toward further reductions. The consumption of transportation was 2.8 percent in the years 19701971 and grew to 13.5 percent in the year 2000-2001. The increasing per- capita disposable income is leading to a subsequent decline in the proportion of spending on basic necessities and an increasing proportion on transportation. Transportation became the second-largest spending category in 2002. Domestic Automobile Industry According to Goldman Sachs' BRIC Team, there will be a significant increase in the middle-class population in India, coupled with an increase in per-capita GDP (in terms of purchasing power parity, PPP), and the team expects India to hit the "sweet spot of car ownership" between 2015 and 2025. These structural changes have totally altered the commercial vehicle market; there will be a structural shift toward heavy commercial vehicles (HCV). The demand for buses will increase substantially, especially for large, luxury buses. International Automobile Market Global Automobile Trends International automobile markets are at crossroads. Factors like consumer prefer- ences, competitive dynamics, the cyclical nature of product design, environmental factors, and regionalism are all factors affecting the global strategy of automobile giants. Motorization and population increases are the two most influential factors in automakers' strategic product management. In countries where population is increasing but motorization is saturated, auto companies have to consolidate their present position as well as launch new products to attract new, young customers. In areas where both factors are increasing, they have to invest in services, supply chain, and new product launches. In the United States, Western Europe, Japan, and South Korea, there was an average sales reduction of 20 percent from 2007 to 2009. The sales growth was unaffected in China but grew in India and Eastern Europe. The global automobile industry is varied not only in strategic orientation but also in customer preferences. For example, for an American automaker, styling means boxiness, a large nose/deck, and an emphasis on size. For a European, it can mean roundness, a short nose/deck, and emphasis on aerodynamics and space efficiency. The engine body, from an American point of view, will be large and powerful engine, a heavy body with slow response. For a Japanese car, the engine can be small, with a light body; the emphasis is on fuel economy and sharp response. In terms of value added, a European wants total balance, while the Japanese want options and many features as standard equipment. The overall image for an American vehicle is that of an all-purpose road cruiser-large, com- fortable, powerful; for a European the automobile is a driving machine-respon- sive, precise, sophisticated. The automobile companies make more profit in selling luxury cars rather than in selling small cars. The revenue shares for participants in the automobile value chain are as follows: suppliers have a 60 percent share of the recommended retail price, assemblers have 10 percent, marketing logistics another 10 percent, and dealers 20 percent. Vehicle manufacturers in mature markets derive about 20 per- cent of revenues and 40 percent of operating profits from sales of spare parts. m Tata Group Tata Group has been one of the largest and most respected industrial houses of India, with a pioneering track record over 130 years. In FY 2004 Tata Group had over 80 companies with leadership presence in most of the sectors. Its revenues were approximately Rs 615 billion (US $13.4 billion, equivalent to 2.6 percent of India's GDP at current prices), and its net profit was Rs 57 billion (US $1.3 billion). Tata Motors In 2004, Tata Motors was India's largest automotive company in terms of revenue. Tata Motors was the market leader in commercial vehicles and the second-largest player in passenger vehicles. In 1954, it began manufacturing vehicles. The firm has demonstrated very strong R&D skill sets with the capability of developing vehi- cle platforms indigenously at a relatively low cost. In 2003, Tata Motors had three manufacturing facilities, in Jamshedpur, Pune, and Lucknow. In 2004, it acquired Daewoo Motors and added the Gunsan plant in South Korea, its first outside India. It had the widest range of product offerings in the Indian market, consisting of commercial vehicles, multiutility vehicles, and passenger cars. International Business Initiatives by Tata Motors in 2004 In 2004, exports were 15 percent of revenues, and Tata Motors made a target of increasing the exports by 20 percent in 2006. Ravi Kanth, Managing Director TML, thought that the best strategy for Tata Motors was focused positioning and marketing in selected countries. South Africa: The market was 360,000 units annually and was comprised of pas- senger cars and pickup trucks. Tata Motors positioned itself as a seller of a "value for money" product there. The production plan was to make the . products in India and ship them to South Africa in 2005. The initial target was 2,000 or more by the third quarter of that year. Sri Lanka: The commercial vehicle volume was approximately 13,800, primarily medium to heavy commercial vehicles (MHCV) and light commercial vehicles (LCVs). The competition in Sri Lanka was from secondhand imports of Japa- nese vehicles. Tata Motors had to cut the Japanese market in Sri Lanka. The plan was to export around 700 vehicles in the third quarter of 2005 and approx- imately 1,800 units in 2005. Russia and East Europe: Targeting the LCV truck market in Russia, Tata Motors started operations in 2004 in the Ukraine through bus assembly. Tata Motors replicated these strategies in other key markets of Southeast and South Asia, Southern Europe, the Middle East, and Africa. Organic Growth Strategies of Tata Motors To develop and sustain a competitive advantage, Tata Motors developed a two- pronged strategy. First, it expanded its capacity. In 2004, the utilization was around 75 percent for commercial vehicles (CVs) and utility vehicles (UVs), and 100 per- cent for the Indica plant, which made passenger cars (PCs). Indica's PC capacity was expanded by 50 percent by the end of 2005. In the same year, CV capacity was expanded and new products were developed (small pickups and intercity and intra- city buses). By 2006-2007, new platforms had been created for global trucks, a new utility vehicle, and compact cars. For the people's car, there were new engine offer- ings and commensurate expansion in R&D capability. The goal was for expansion into new markets and product categories, both domestically and internationally. . Inorganic Growth Planning of Tata Motors in 2004 Tata Motor's philosophy of inorganic growth was as follows: Acquiring an international company for (a) access to markets, (b) access to new technology and R&D capability, and (c) growth in international business. Marketing tie-ins for (a) distribution and (b) cobranding. Asset purchases for (a) new products, (b) new technology, and (c) new capacities. Strategic alliances for (a) product swaps and (b) R&D alliances. There were further challenges for Tata Motors, such as cost pressures on input materials like steel, engineering plastics, aluminum, copper, and so on. As of April 2005, the company also felt the impact of emission compliance measures. Eleven cities in India have migrated to Euro III, while the rest of the country will migrate to Euro II emission norms. The cost of meeting the emission standards may lead to an increase in price, leading to sluggish demand conditions in 2006. Fuel price increases are also a factor. Furthermore, the automotive business model was changing. Automobile manu- facturers were making money not only by selling cars but also by maintaining them and selling accessories. Tata Motors acquired Daewoo Commercial Vehicle Co. (DWCV) of Korea and made it a 100 percent subsidiary on March 30, 2004. The HCV was a product seg- ment of DWCV and a complementary product for Tata. The acquisition gave Tata access to assembly technology for high-end trucks, the potential for leading the domestic market in high-end trucks, and an entry to the South Korea market for medium and intermediate commercial vehicles. Tata had a market share of 25 per- cent as well as an additional annual production capacity of 20,000 units. The pur- chase was a very profitable venture, earning Tata US $5.4 million on a turnover of US $222 million in fiscal year 2003 on a 21 percent of Daewoo's capacity utilization. Positioning of Tata Motors in the Global Markets Ravi Kanth, Tata's Managing Director, had to decide on a positioning strategy for Tata Motors in the global markets. Tata Motors aspired to be among the top global manufacturers in the product group of medium and heavy trucks. In pickup trucks, Tata had to establish a presence in the global segment and couple that with a high domestic demand potential. Tata also targeted the niche global mar- kets in the compact car segment. Enhancing Capabilities: Partnering with World-Class Players Tata Motors is no stranger to global partnering: 1. In a joint venture with Marcopolo (Tata Motors, 51 percent; Marcopolo, 49 percent), the goal was to take advantage of product development and partici- pation in mass transport opportunities in Indian and international markets, The target is to produce 150,000 buses (24 to 54-seaters) in five years using India's low-cost advantage. 2. In an alliance with Fiat, (a) Fiat distributes products in India and (b) the two companies engage in a joint manufacturing venture (Tata Motors, 50 percent; Fiat, 50 percent) in India. Tata gained access to world-class car engine technol- ogy. Both companies gained access to a production capacity of 100,000 cars and 250,000 units of engines and transmissions for use globally. 3. To capitalize on the regional trading block ASEAN and local country compe- tencies, Tata formed a joint venture in Thailand with Thonburi Thailand (Tata Motors, 70 percent; Thonburi, 30 percent). In Phase I, the production capacity was 12,500 units per annum. In March 2008, Xenon was launched in Thailand, and an eco car project started. 4. To deal with customs in South Africa, Tata Motors formed a subsidiary (Tata Motors, 60 percent; Tata Africa, 40 percent). The products manufactured will be passenger and commercial vehicles. Despite this track record, many were surprised when Tata Motors acquired Jaguar Land Rover for US $2.3 billion. Tata had its reasons for the purchase: (a) the oppor- tunity to participate in two fast-growing auto segments (premium and small cars) and to build a comprehensive product portfolio with an immediate global footprint; (b) to increase business diversity across markets and product segments; (c) to get a unique opportunity to move into a premium segment with access to world-class iconic brands; (d) to fit Land Rover naturally above Tata's utility/sport utility/cross- over offerings for the 4 x 4 premium category and to broaden the brand portfolio with Jaguar's performance/luxury vehicles; and (e) to enjoy long-term benefits from component sourcing, low-cost engineering, and design services. For any company to survive, its organizational structure must be excellent and coupled with a suitable business model, effective cost control mechanisms, appro- priate products and services, ample resource capabilities, process, and quality, as well as with organic and inorganic growth strategies


