

Question: (c) Using this data, fit a least squares regression to predict y using x1 and x2. Describe the results obtained. What are Bo, B1, and
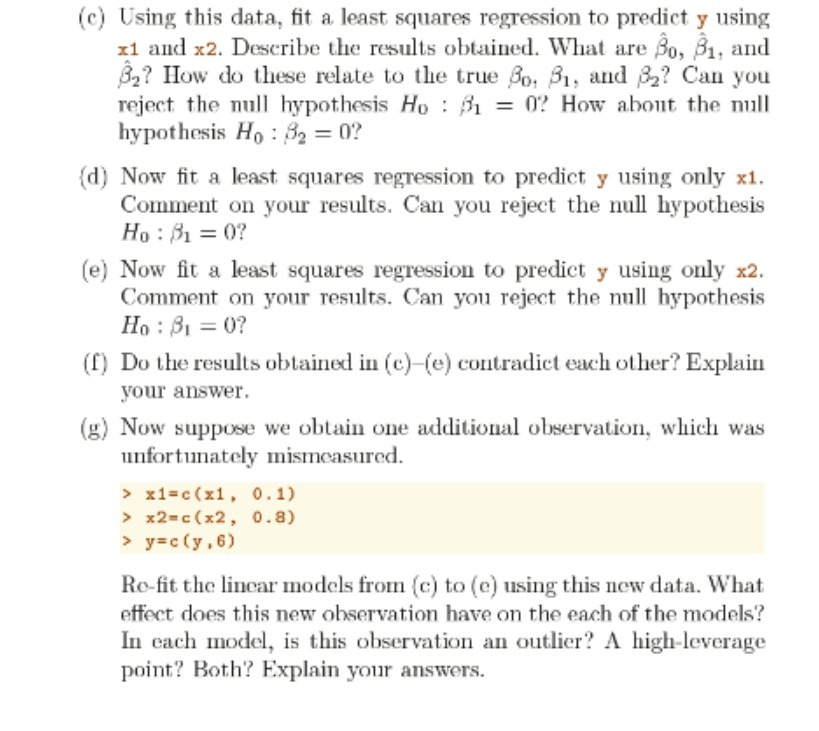
(c) Using this data, fit a least squares regression to predict y using x1 and x2. Describe the results obtained. What are Bo, B1, and 32? How do these relate to the true Bo, B1, and 32? Can you reject the null hypothesis Ho : 31 = 0? How about the null hypothesis Ho : 32 = 0? (d) Now fit a least squares regression to predict y using only x1. Comment on your results. Can you reject the null hypothesis Ho : 81 = 0? (e) Now fit a least squares regression to predict y using only x2. Comment on your results. Can you reject the null hypothesis Ho : 81 = 0? (f) Do the results obtained in (c)-(e) contradict each other? Explain your answer. (g) Now suppose we obtain one additional observation, which was unfortunately mismeasured. > x1=c(x1, 0.1) > x2=c (x2, 0.8) > y=c (y , 6) Ro-fit the linear models from (c) to (e) using this new data. What effect does this new observation have on the each of the models? In each model, is this observation an outlier? A high-leverage point? Both? Explain your answers
Step by Step Solution
There are 3 Steps involved in it

Get step-by-step solutions from verified subject matter experts