

Question: c) Using your graph from part b), clearly indicate on the graph: i) how many tonnes of sand should be mined per day to maximise
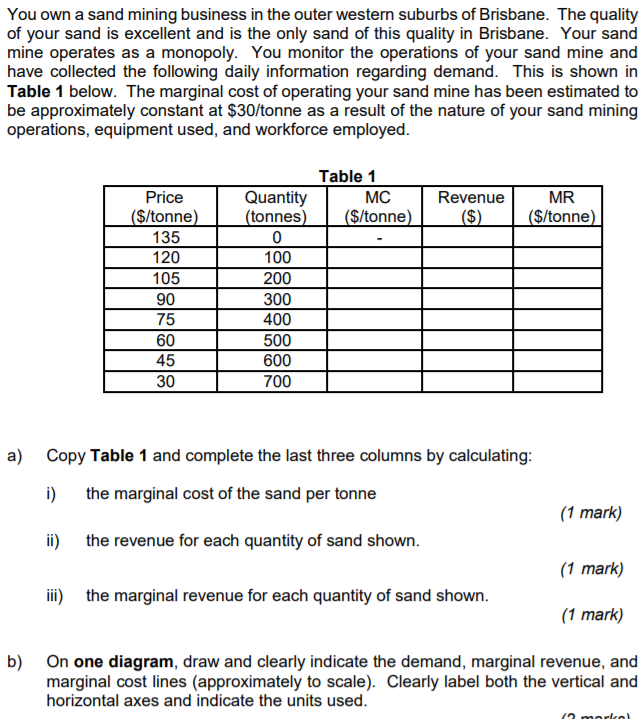
c) Using your graph from part b), clearly indicate on the graph: i) how many tonnes of sand should be mined per day to maximise profits. Assume this decision is based on using marginal analysis where the marginal benefits must equal the marginal costs of mining the sand. (1 mark) ii) the price to sell the sand ($/tonne) to maximise profits. (1 mark) d) The marginal cost for the sand mining operation was given as $30/tonne. Write an equation, or define in words, what is meant by marginal cost. (1 mark) ii) Thinking about a large-scale sand mining operation and the likely costs involved, explain in less than 50 words why marginal cost could be constant at $30/tonne. (3 marks)You own a sand mining business in the outerwestem suburbs of Brisbane. The quality of your sand is excellent and is the only sand of this quality in Brisbane. Your sand mine operates as a monopoly. You monitor the operations of your sand mine and have collected the following daily information regarding demand. This is shown in Table 1 below. The marginal cost of operating your sand mine has been estimated to be approximately constant at $30ftonne as a result of the nature of your sand mining operations. equipment used, and workforce employed. bl Table 1 Copy Table 1 and complete the last three columns by calculating: i) the marginal cost of the sand per tonne (1 mark} ii) the revenue for each quantity of sand shown. (1 mark} iii} the marginal revenue for each quantity of sand shown. (I mark) On one diagram, draw and clearly indicate the demand. marginal revenue, and marginal cost lines (approximately to scale). Cleariy label both the vertical and horizontal axes and indicate the units used. ("I unhnl
Step by Step Solution
There are 3 Steps involved in it

Get step-by-step solutions from verified subject matter experts