

Question: C. What is the current process performance level according to the process capability ratio? ______ sigma performance. Problem 28 the table of factors for calculating
C. What is the current process performance level according to the process capability ratio? ______ sigma performance.
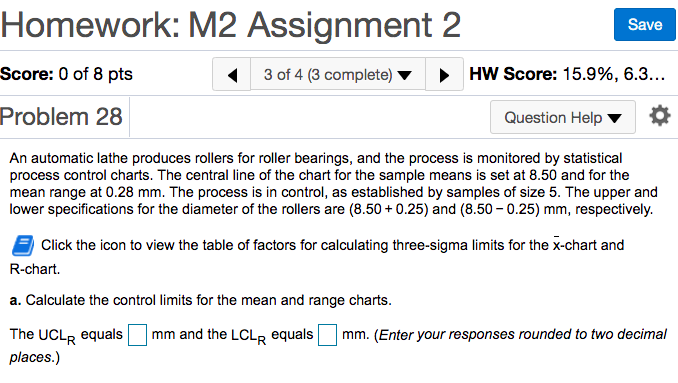
Problem 28
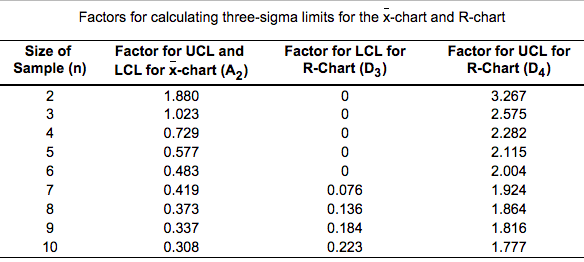
the table of factors for calculating three-sigma limits for the x-chart and R-chart. (below)
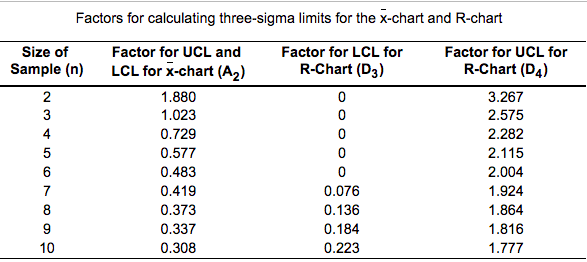
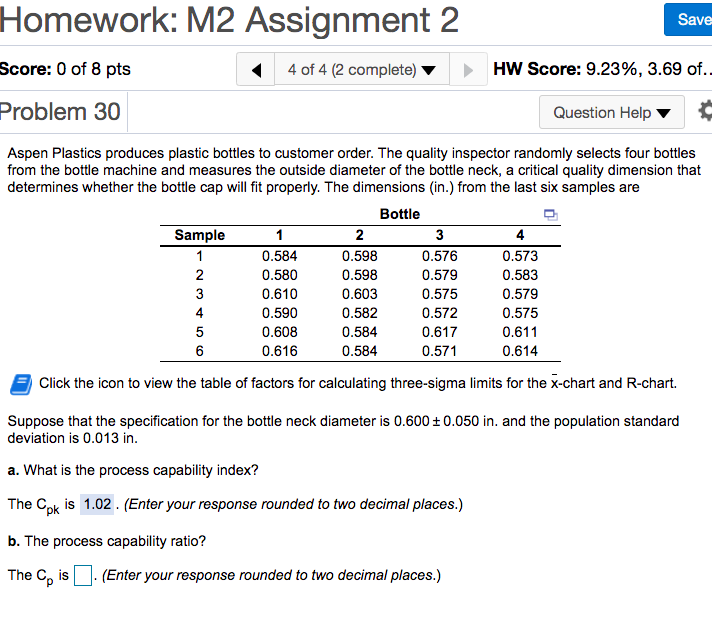
Homework: M2 Assignment 2 Save Score: 0 of 8 pts 4 of 4 (2 complete) HW Score: 9.23%, 3.69 of.. Problem 30 Question Help Aspen Plastics produces plastic bottles to customer order. The quality inspector randomly selects four bottles from the bottle machine and measures the outside diameter of the bottle neck, a critical quality dimension that determines whether the bottle cap will fit properly. The dimensions (in.) from the last six samples are Bottle Sample 1 2 3 4 1 0.584 0.598 0.576 0.573 2 0.580 0.598 0.579 0.583 3 0.610 0.603 0.575 0.579 4 0.590 0.582 0.572 0.575 5 0.608 0.584 0.617 0.611 6 0.616 0.584 0.571 0.614 Click the icon to view the table of factors for calculating three-sigma limits for the x-chart and R-chart. Suppose that the specification for the bottle neck diameter is 0.600 +0.050 in. and the population standard deviation is 0.013 in. a. What is the process capability index? The Cpk is 1.02 . (Enter your response rounded to two decimal places.) b. The process capability ratio? The Cp is (Enter your response rounded to two decimal places.) Factors for calculating three-sigma limits for the x-chart and R-chart Size of Sample (n) 2 3 4 5 6 7 8 9 10 Factor for UCL and LCL for X-chart (A2) 1.880 1.023 0.729 0.577 0.483 0.419 0.373 0.337 0.308 Factor for LCL for R-Chart (D3) 0 0 0 0 0 0.076 0.136 0.184 0.223 Factor for UCL for R-Chart (D4) 3.267 2.575 2.282 2.115 2.004 1.924 1.864 1.816 1.777 Homework: M2 Assignment 2 Save Score: 0 of 8 pts 3 of 4 (3 complete) HW Score: 15.9%, 6.3... Problem 28 Question Help An automatic lathe produces rollers for roller bearings, and the process is monitored by statistical process control charts. The central line of the chart for the sample means is set at 8.50 and for the mean range at 0.28 mm. The process is in control, as established by samples of size 5. The upper and lower specifications for the diameter of the rollers are (8.50 +0.25) and (8.50 -0.25) mm, respectively. Click the icon to view the table of factors for calculating three-sigma limits for the x-chart and R-chart. a. Calculate the control limits for the mean and range charts. The UCLR equals places.) mm and the LCLR equals mm. (Enter your responses rounded to two decimal
Step by Step Solution
There are 3 Steps involved in it
1 Expert Approved Answer
Step: 1 Unlock

It seems that youve uploaded multiple images with the same topic related to statistical process control Based on the question provided and the informa... View full answer
Question Has Been Solved by an Expert!
Get step-by-step solutions from verified subject matter experts
Step: 2 Unlock
Step: 3 Unlock