

Question: C2. The sample mean and range for the production processes are listed below: Samples 1 2 3 4 5 6 7 8 9 Sample 49
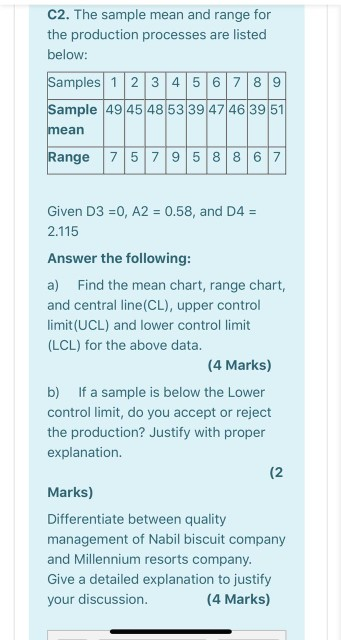
C2. The sample mean and range for the production processes are listed below: Samples 1 2 3 4 5 6 7 8 9 Sample 49 45 48 53 39 47 46 39 51 mean Range 7 5 7 9 5 8 8 6 7 Given D3 =0, A2 = 0.58, and D4 = 2.115 Answer the following: a) Find the mean chart,range chart, and central line(CL), upper control limit (UCL) and lower controllimit (LCL) for the above data. (4 Marks) b) If a sample is below the Lower control limit, do you accept or reject the production? Justify with proper explanation. (2 Marks) Differentiate between quality management of Nabil biscuit company and Millennium resorts company. Give a detailed explanation to justify your discussion (4 Marks)
Step by Step Solution
There are 3 Steps involved in it
1 Expert Approved Answer
Step: 1 Unlock

Question Has Been Solved by an Expert!
Get step-by-step solutions from verified subject matter experts
Step: 2 Unlock
Step: 3 Unlock