

Question: Cairo Consulting EXPLORE BUSINESS OPTIONS WITH WHAT-IF TOOLS GETTING STARTED Open the file NP_EX19_8a_FirstLastName_1.xlsx, available for download from the SAM website. Save the file as
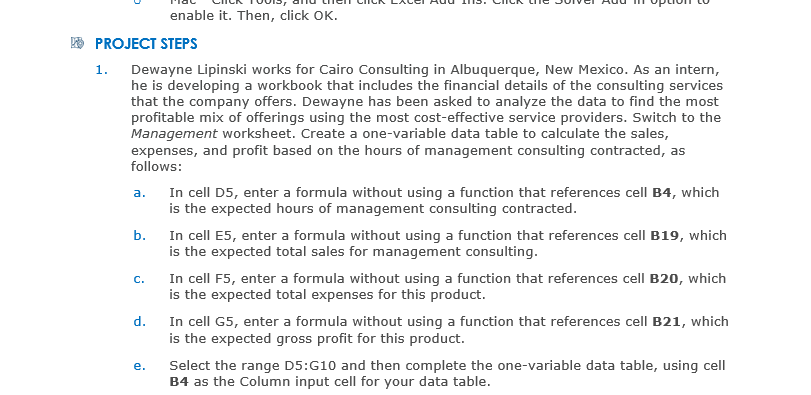
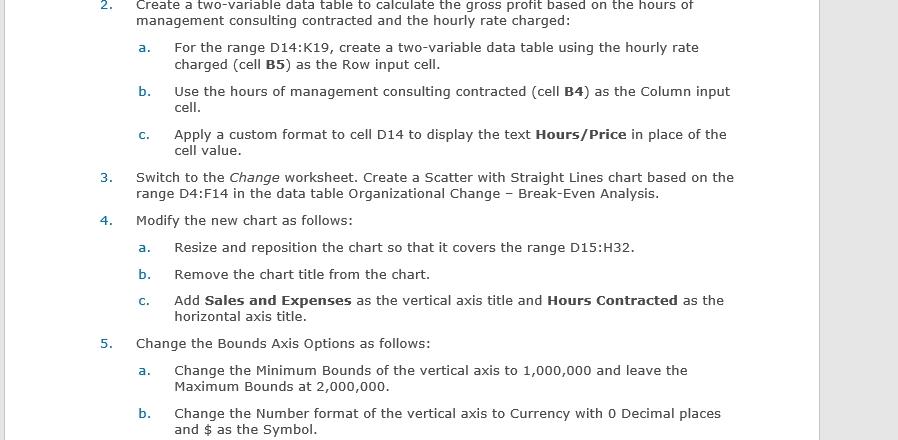
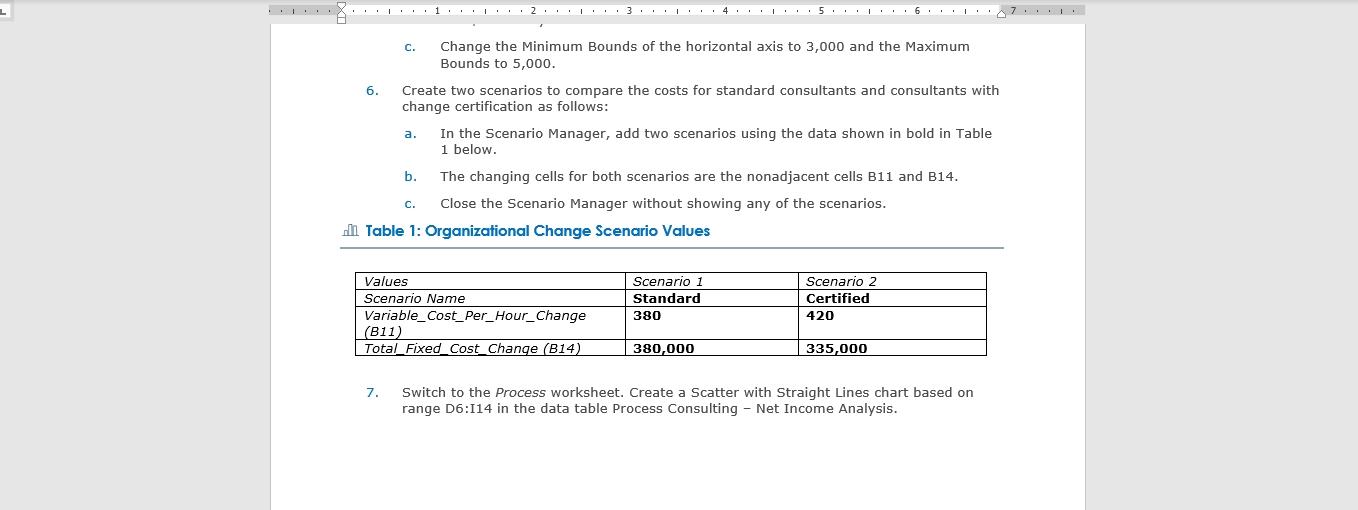
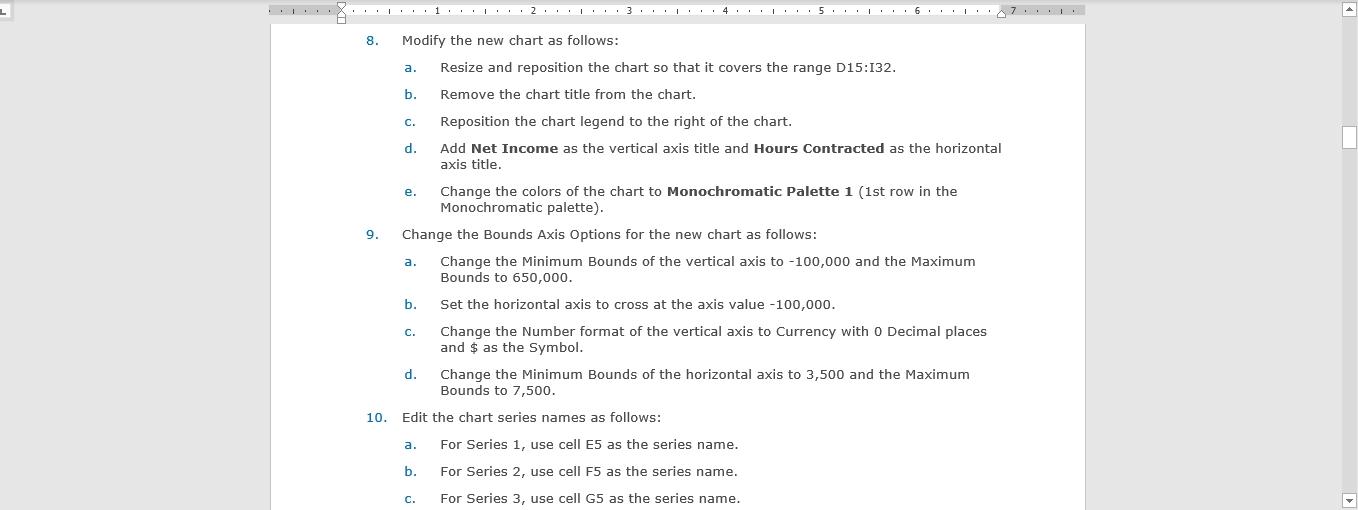
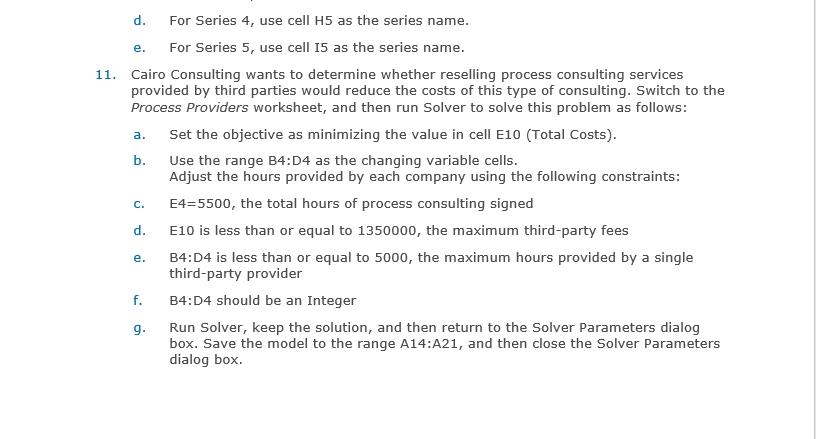
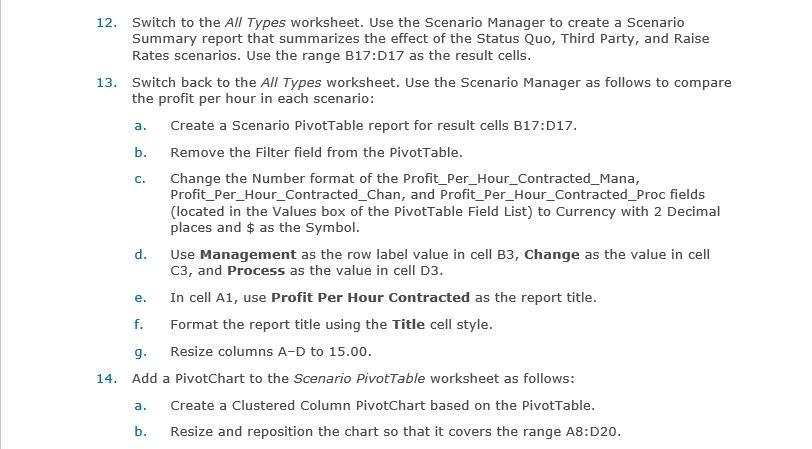
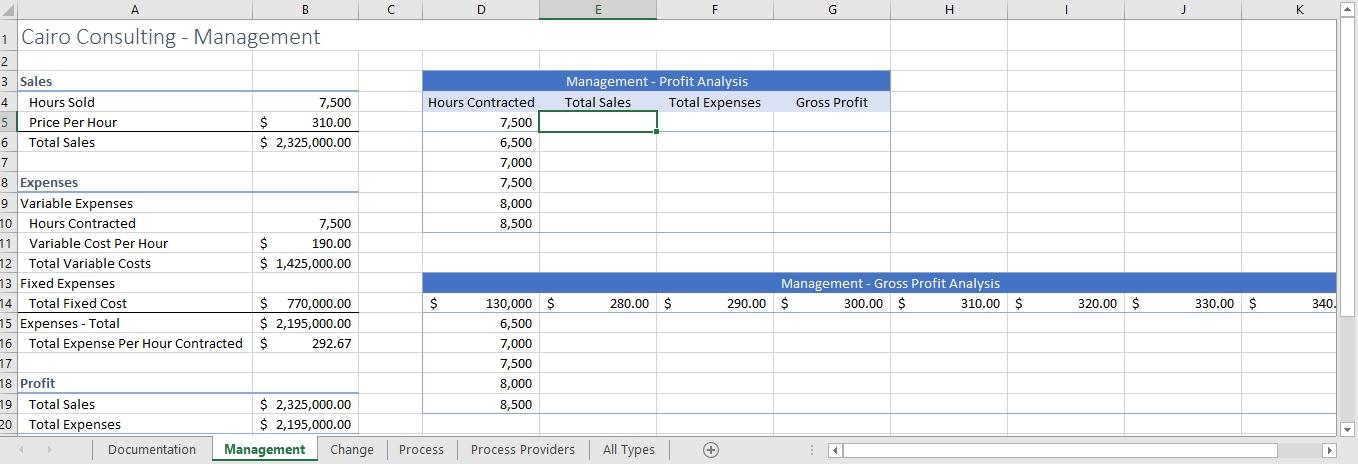
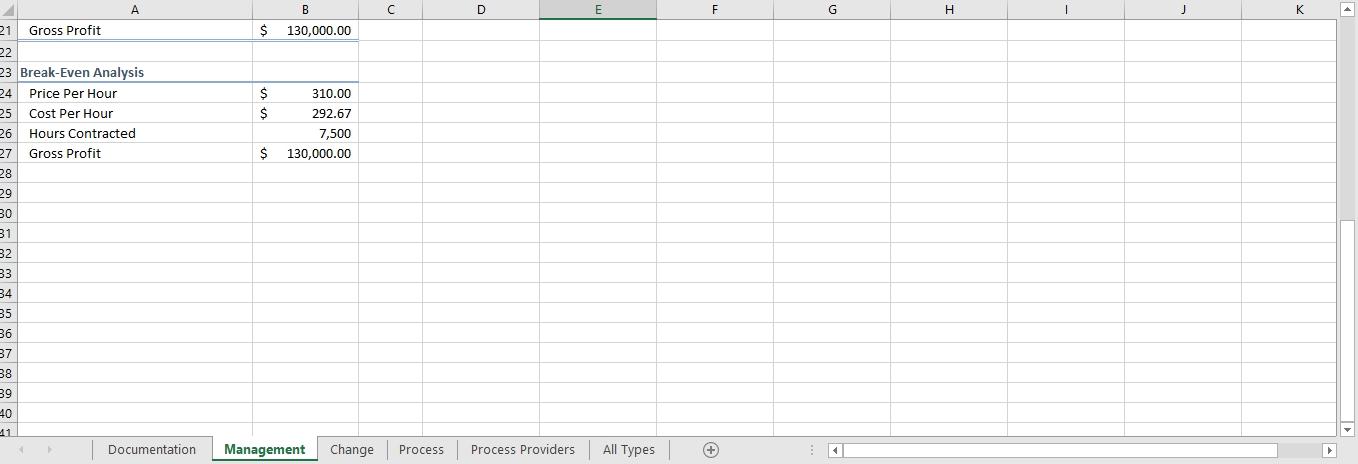
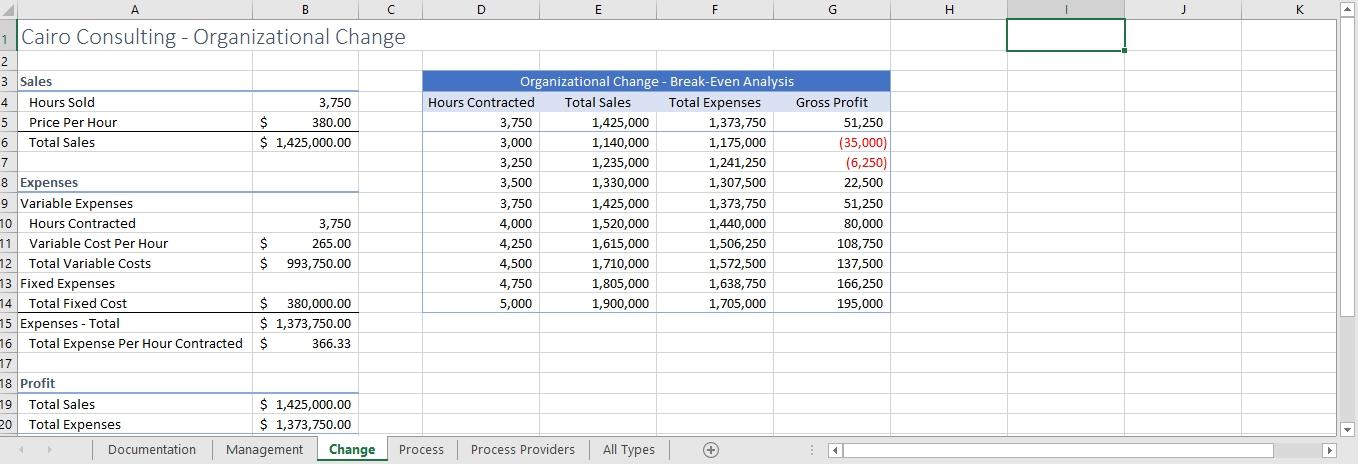
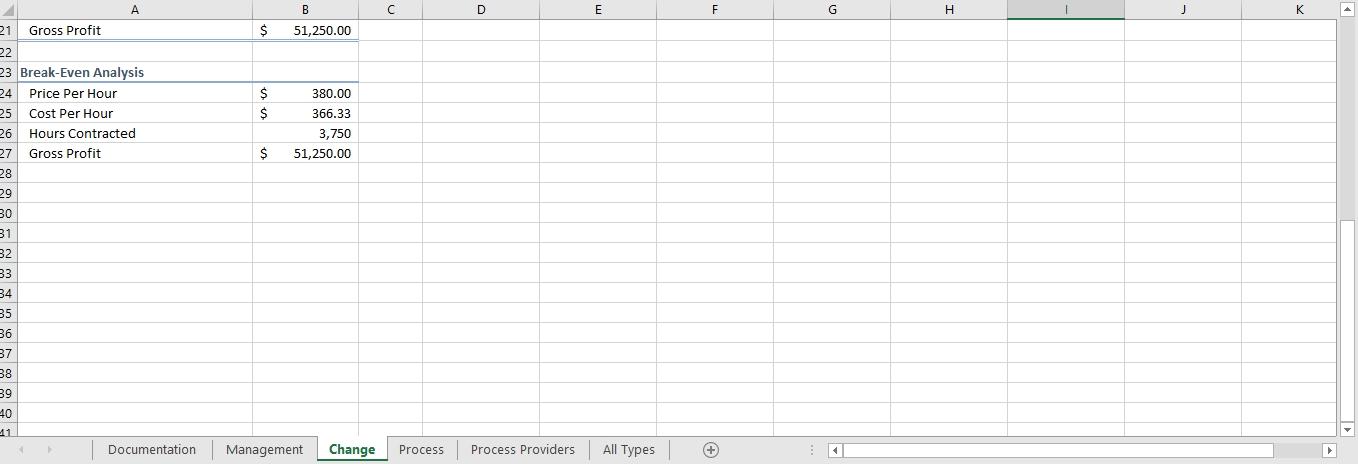
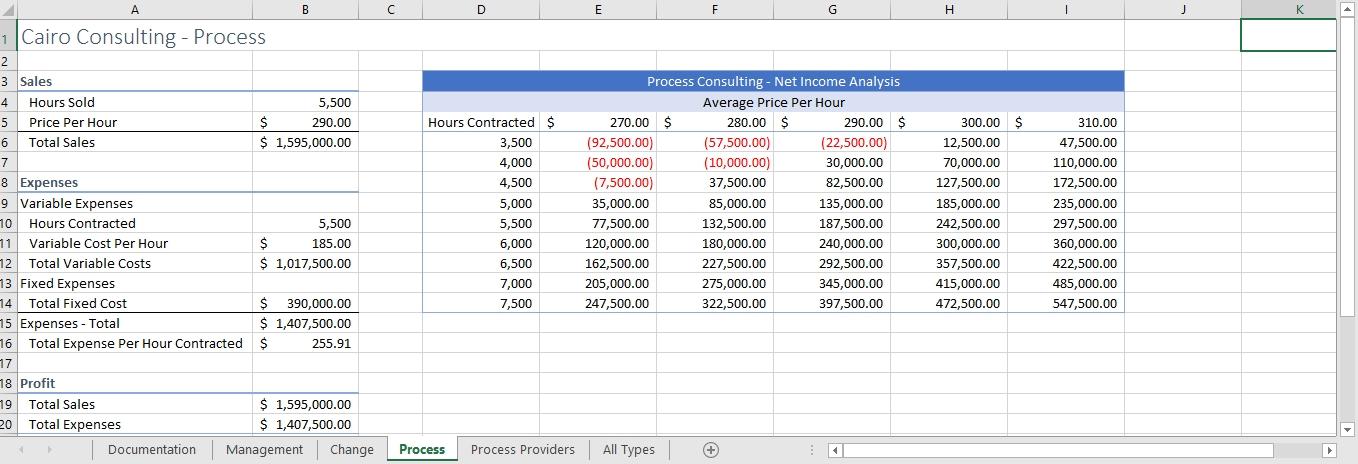
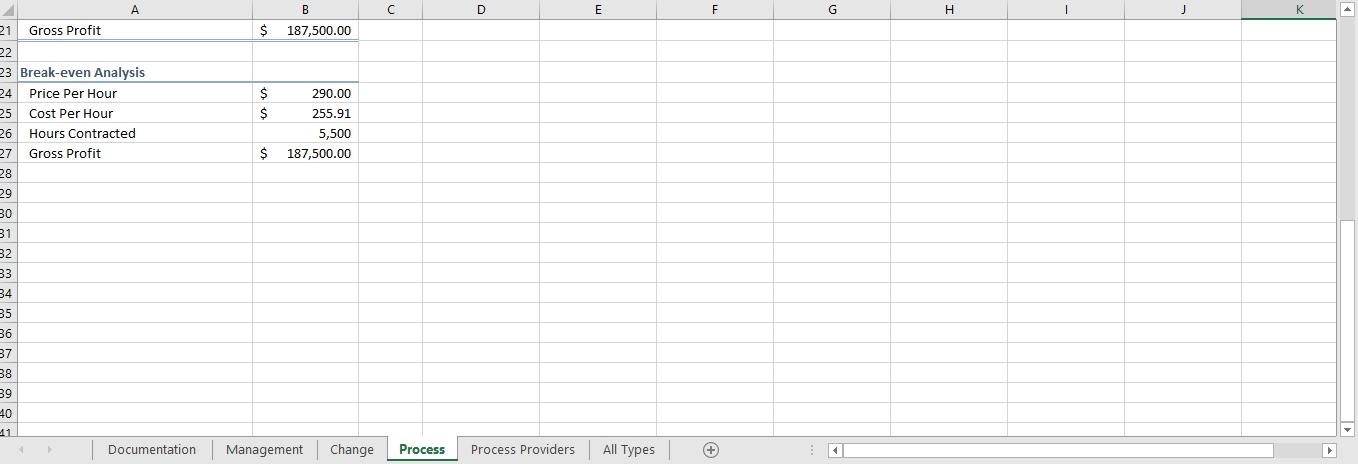
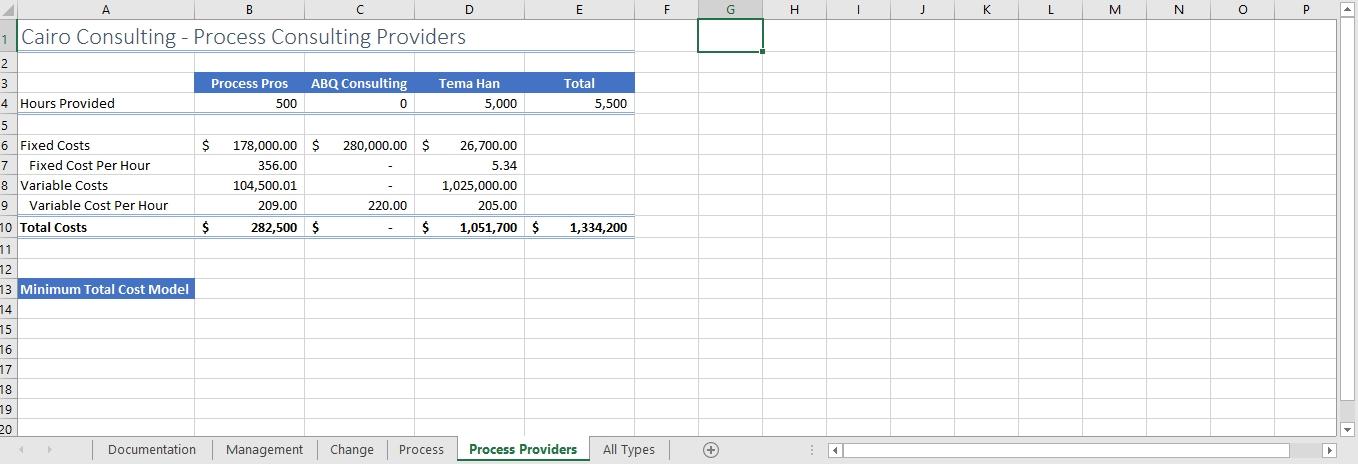
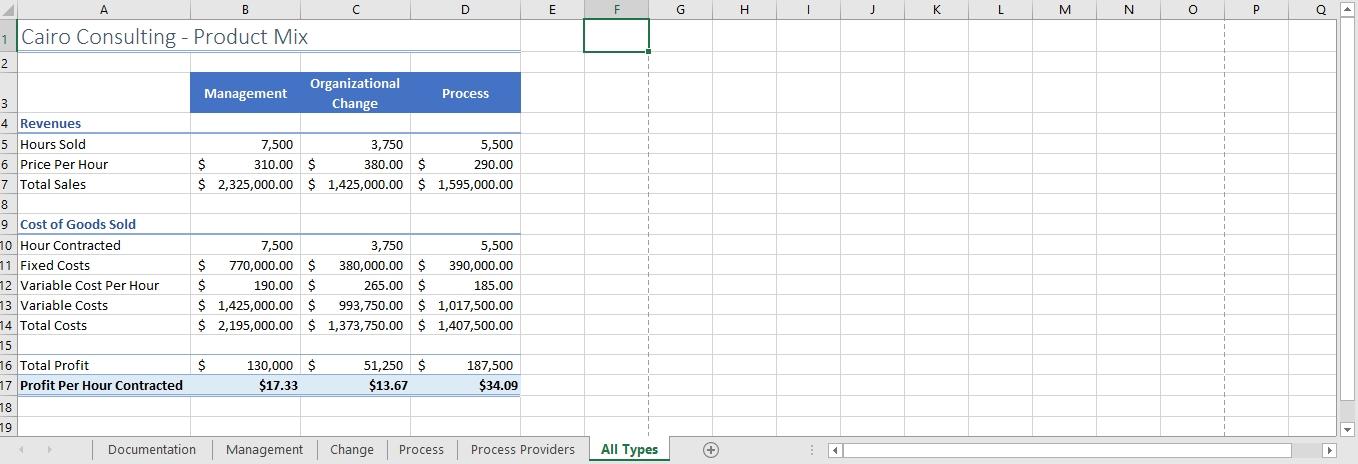
Cairo Consulting EXPLORE BUSINESS OPTIONS WITH WHAT-IF TOOLS GETTING STARTED Open the file NP_EX19_8a_FirstLastName_1.xlsx, available for download from the SAM website. Save the file as NP_EX19_8a_FirstLastName_2.xlsx by changing the "1" to a "2". If you do not see the .xlsx file extension in the Save As dialog box, do not type it. The program will add the file extension for you automatically. With the file NP_EX19_8a_FirstLastName_2.xlsx still open, ensure that your first and last name is displayed in cell B6 of the Documentation sheet. If cell B6 does not display your name, delete the file and download a new copy from the SAM website. This project requires you to use the Solver add-in. If this add-in is not available on the Data tab in the Analyze group (or if the Analyze group is not available), install Solver as follows: PC - In Excel, click the File tab, and then click the Options button in the left navigation bar. Click the Add-Ins option in the left pane of the Excel Options dialog box. Click the Manage arrow, click the Excel Add-Ins option, and then click the Go button. In the Add-Ins dialog box, click the Solver Add-In check box and then click the OK button. Follow any remaining prompts to install Solver. a. enable it. Then, click OK. DE PROJECT STEPS 1. Dewayne Lipinski works for Cairo Consulting in Albuquerque, New Mexico. As an intern, he is developing a workbook that includes the financial details of the consulting services that the company offers. Dewayne has been asked to analyze the data to find the most profitable mix of offerings using the most cost-effective service providers. Switch to the Management worksheet. Create a one-variable data table to calculate the sales, expenses, and profit based on the hours of management consulting contracted, as follows: In cell D5, enter a formula without using a function that references cell B4, which is the expected hours of management consulting contracted. b. In cell E5, enter a formula without using a function that references cell B19, which is the expected total sales for management consulting. In cell F5, enter a formula without using a function that references cell B20, which is the expected total expenses for this product. d. In cell G5, enter a formula without using a function that references cell B21, which is the expected gross profit for this product. Select the range D5:G10 and then complete the one-variable data table, using cell B4 as the Column input cell for your data table. C. e. 2. a. C. 3. 4. Create a two-variable data table to calculate the gross profit based on the hours of management consulting contracted and the hourly rate charged: For the range D14:K19, create a two-variable data table using the hourly rate charged (cell B5) as the Row input cell. b. Use the hours of management consulting contracted (cell B4) as the Column input cell. Apply a custom format to cell D14 to display the text Hours/Price in place of the cell value. Switch to the Change worksheet. Create a Scatter with Straight Lines chart based on the range D4:F14 in the data table Organizational Change - Break-Even Analysis. Modify the new chart as follows: Resize and reposition the chart so that it covers the range D15:H32. Remove the chart title from the chart. Add Sales and Expenses as the vertical axis title and Hours Contracted as the horizontal axis title. Change the Bounds Axis Options as follows: Change the Minimum Bounds of the vertical axis to 1,000,000 and leave the Maximum Bounds at 2,000,000. b. Change the Number format of the vertical axis to Currency with o Decimal places and $ as the Symbol. a. b. C. 5. a. XIII.1. III.2.1.3.4.1.5. III:6:47 a. C. Change the Minimum Bounds of the horizontal axis to 3,000 and the Maximum Bounds to 5,000. 6. Create two scenarios to compare the costs for standard consultants and consultants with change certification as follows: In the Scenario Manager, add two scenarios using the data shown in bold in Table 1 below. b. The changing cells for both scenarios are the nonadjacent cells B11 and B14. Close the Scenario Manager without showing any of the scenarios. Il Table 1: Organizational Change Scenario Values c. Values Scenario Name Variable_Cost_per_Hour_Change (B11) Total_Fixed_Cost_Change (B14) Scenario 1 Standard 380 Scenario 2 Certified 420 380,000 335,000 7. Switch to the Process worksheet. Create a Scatter with Straight Lines chart based on range D6:114 in the data table Process Consulting - Net Income Analysis. XIII.1. III.2.1.3.4.1.5. III:6:47 8. Modify the new chart as follows: a. Resize and reposition the chart so that it covers the range D15:132. b. Remove the chart title from the chart. c. Reposition the chart legend to the right of the chart. d. Add Net Income as the vertical axis title and Hours Contracted as the horizontal axis title. a. e. Change the colors of the chart to Monochromatic Palette 1 (1st row in the Monochromatic palette). 9. Change the Bounds Axis Options for the new chart as follows: Change the Minimum Bounds of the vertical axis to -100,000 and the Maximum Bounds to 650,000. b. Set the horizontal axis to cross at the axis value -100,000. Change the Number format of the vertical axis to Currency with O Decimal places and $ as the Symbol. d. Change the Minimum Bounds of the horizontal axis to 3,500 and the Maximum Bounds to 7,500. 10. Edit the chart series names as follows: a. For Series 1, use cell E5 as the series name. b. For Series 2, use cell F5 as the series name. c. For Series 3, use cell G5 as the series name. e. a. d. For Series 4, use cell 45 as the series name. For Series 5, use cell 15 as the series name. 11. Cairo Consulting wants to determine whether reselling process consulting services provided by third parties would reduce the costs of this type of consulting. Switch to the Process Providers worksheet, and then run Solver to solve this problem as follows: Set the objective as minimizing the value in cell E10 (Total Costs). b. Use the range B4:04 as the changing variable cells. Adjust the hours provided by each company using the following constraints: E4=5500, the total hours of process consulting signed d. E10 is less than or equal to 1350000, the maximum third-party fees B4:04 is less than or equal to 5000, the maximum hours provided by a single third-party provider f. B4:04 should be an Integer g. Run Solver, keep the solution, and then return to the Solver Parameters dialog box. Save the model to the range A14:A21, and then close the Solver Parameters dialog box. C. e. a. c. 12. Switch to the All Types worksheet. Use the Scenario Manager to create a Scenario Summary report that summarizes the effect of the Status Quo, Third Party, and Raise Rates scenarios. Use the range B17:017 as the result cells. 13. Switch back to the All Types worksheet. Use the Scenario Manager as follows to compare the profit per hour in each scenario: Create a Scenario PivotTable report for result cells B17:017. b. Remove the Filter field from the Pivottable. Change the Number format of the Profit_Per_Hour_Contracted_Mana, Profit_per_Hour_Contracted_Chan, and Profit_Per_Hour_Contracted_Proc fields (located in the Values box of the PivotTable Field List) to Currency with 2 Decimal places and $ as the Symbol. d. Use Management as the row label value in cell B3, Change as the value in cell c3, and Process as the value in cell D3. In cell A1, use Profit Per Hour Contracted as the report title. f. Format the report title using the Title cell style. g. Resize columns A-D to 15.00. 14. Add a PivotChart to the Scenario PivotTable worksheet as follows: Create a Clustered Column PivotChart based on the Pivottable. b. Resize and reposition the chart so that it covers the range A8:D20. e. a. Hide the field buttons in the chart. [Mac Hint: The Field Buttons option is not available on Excel 2019 for the Mac, so Mac users can ignore this instruction.] Your workbook should look like the Final Figures on the following pages. Save your changes, close the workbook, and then exit Excel. Follow the directions on the SAM website to submit your completed project. A B D E F G H J K Management - Profit Analysis Total Sales Total Expenses Gross Profit Hours Contracted 7,500 6,500 7,000 7,500 8,000 8,500 1 Cairo Consulting - Management 2 3 Sales 4 Hours Sold 7,500 5 Price Per Hour $ 310.00 6 Total Sales $ 2,325,000.00 7 8 Expenses 9 Variable Expenses 10 Hours Contracted 7,500 11 Variable Cost Per Hour $ 190.00 12 Total Variable Costs $ 1,425,000.00 73 Fixed Expenses 74 Total Fixed Cost $ 770,000.00 15 Expenses - Total $ 2,195,000.00 16 Total Expense Per Hour Contracted $ 292.67 17 18 Profit 19 Total Sales $ 2,325,000.00 20 Total Expenses $ 2,195,000.00 Documentation Management Change Management - Gross Profit Analysis 290.00 $ 300.00 $ 310.00 $ $ 280.00 $ 320.00 $ 330.00 $ 340. 130,000 $ 6,500 7,000 7,500 8,000 8,500 Process Process Providers All Types + D F G H - J K $ 130,000.00 $ $ 310.00 292.67 7,500 130,000.00 $ 21 Gross Profit 22 23 Break-Even Analysis 24 Price Per Hour 25 Cost Per Hour 26 Hours Contracted 27 Gross Profit 28 29 30 31 32 33 34 35 36 37 38 39 40 Documentation Management Change Process Process Providers All Types + H J K A B C D E F G 1 Cairo Consulting - Organizational Change 2 3 Sales Organizational Change - Break-Even Analysis 4 Hours Sold 3,750 Hours Contracted Total Sales Total Expenses Gross Profit 5 Price Per Hour $ 380.00 3,750 1,425,000 1,373,750 51,250 6 Total Sales $ 1,425,000.00 3,000 1,140,000 1,175,000 (35,000) 7 3,250 1,235,000 1,241,250 (6,250) 8 Expenses 3,500 1,330,000 1,307,500 22,500 9 Variable Expenses 3,750 1,425,000 1,373,750 51,250 10 Hours Contracted 3,750 4,000 1,520,000 1,440,000 80,000 11 Variable Cost Per Hour $ 265.00 4,250 1,615,000 1,506,250 108,750 12 Total Variable Costs $ 993,750.00 4,500 1,710,000 1,572,500 137,500 73 Fixed Expenses 4,750 1,805,000 1,638,750 166,250 74 Total Fixed Cost $ 380,000.00 5,000 1,900,000 1,705,000 195,000 15 Expenses - Total $ 1,373,750.00 16 Total Expense Per Hour Contracted $ 366.33 17 18 Profit 19 Total Sales $ 1,425,000.00 20 Total Expenses $ 1,373,750.00 Documentation Management Change Process Process Providers + All Types D E F G H J K B 51,250.00 $ $ $ 380.00 366.33 3,750 51,250.00 $ 21 Gross Profit 22 23 Break-Even Analysis 24 Price Per Hour 25 Cost Per Hour 26 Hours Contracted 27 Gross Profit 28 29 30 31 32 33 34 35 36 37 38 39 40 Documentation Management Change Process Process Providers All Types + G H Hours Contracted $ 3,500 4,000 4,500 5,000 Process Consulting - Net Income Analysis Average Price Per Hour 270.00 $ 280.00 $ 290.00 $ (92,500.00) (57,500.00) (22,500.00) (50,000.00) (10,000.00) 30,000.00 (7,500.00) 37,500.00 82,500.00 35,000.00 85,000.00 135,000.00 77,500.00 132,500.00 187,500.00 120,000.00 180,000.00 240,000.00 162,500.00 227,500.00 292,500.00 205,000.00 275,000.00 345,000.00 247,500.00 322,500.00 397,500.00 1 Cairo Consulting - Process 2 3 Sales 4 Hours Sold 5,500 5 Price Per Hour $ 290.00 6 Total Sales $ 1,595,000.00 7 8 Expenses 9 Variable Expenses 10 Hours Contracted 5,500 11 Variable Cost Per Hour $ 185.00 12 Total Variable Costs $ 1,017,500.00 73 Fixed Expenses 14 Total Fixed Cost $ 390,000.00 15 Expenses - Total $ 1,407,500.00 16 Total Expense Per Hour Contracted $ 255.91 17 18 Profit 19 Total Sales $ 1,595,000.00 20 Total Expenses $ 1,407,500.00 Documentation Management Change 300.00 $ 12,500.00 70,000.00 127,500.00 185,000.00 242,500.00 300,000.00 357,500.00 415,000.00 472,500.00 310.00 47,500.00 110,000.00 172,500.00 235,000.00 297,500.00 360,000.00 422,500.00 485,000.00 547,500.00 5,500 6,000 6,500 7,000 7,500 Process Process Providers All Types + D E F G H - J $ 187,500.00 $ $ 290.00 255.91 5,500 187,500.00 $ 21 Gross Profit 22 23 Break-even Analysis 24 Price Per Hour 25 Cost Per Hour 26 Hours Contracted 27 Gross Profit 28 29 30 31 32 33 34 35 36 37 38 39 40 Documentation Management Change Process Process Providers All Types + A B D E F G H J L M N N o P Total 5,500 1 Cairo Consulting - Process Consulting Providers 2 3 Process Pros ABQ Consulting Tema Han 4 Hours Provided 500 0 5,000 5 5 6 Fixed Costs $ 178,000.00 $ 280,000.00 $ 26,700.00 7 Fixed Cost Per Hour 356.00 5.34 8 Variable Costs 104,500.01 1,025,000.00 9 Variable Cost Per Hour 209.00 220.00 205.00 10 Total Costs $ 282,500 $ $ 1,051,700 $ 11 12 13 Minimum Total Cost Model 14 - 1,334,200 15 16 17 18 19 20 Documentation Management Change Process Process Providers All Types + A B D E F G H J K L M N o o 1 1 Cairo Consulting - Product Mix 2 Organizational Management Process 3 Change 4 Revenues 5 Hours Sold 7,500 3,750 5,500 6 Price Per Hour $ 310.00 $ 380.00 $ 290.00 7 Total Sales $ 2,325,000.00 $ 1,425,000.00 $ 1,595,000.00 8 9 Cost of Goods Sold 10 Hour Contracted 7,500 3,750 5,500 11 Fixed Costs $ 770,000.00 $ 380,000.00 $ 390,000.00 12 Variable Cost Per Hour $ 190.00 $ 265.00 $ 185.00 13 Variable Costs $ 1,425,000.00 $ 993,750.00 $ 1,017,500.00 14 Total Costs $ 2,195,000.00 $ 1,373,750.00 $ 1,407,500.00 15 76 Total Profit $ 130,000 $ 51,250 $ 187,500 17 Profit Per Hour Contracted $17.33 $13.67 $34.09 18 19 Documentation Management Change Process Process Providers All Types (+) Cairo Consulting EXPLORE BUSINESS OPTIONS WITH WHAT-IF TOOLS GETTING STARTED Open the file NP_EX19_8a_FirstLastName_1.xlsx, available for download from the SAM website. Save the file as NP_EX19_8a_FirstLastName_2.xlsx by changing the "1" to a "2". If you do not see the .xlsx file extension in the Save As dialog box, do not type it. The program will add the file extension for you automatically. With the file NP_EX19_8a_FirstLastName_2.xlsx still open, ensure that your first and last name is displayed in cell B6 of the Documentation sheet. If cell B6 does not display your name, delete the file and download a new copy from the SAM website. This project requires you to use the Solver add-in. If this add-in is not available on the Data tab in the Analyze group (or if the Analyze group is not available), install Solver as follows: PC - In Excel, click the File tab, and then click the Options button in the left navigation bar. Click the Add-Ins option in the left pane of the Excel Options dialog box. Click the Manage arrow, click the Excel Add-Ins option, and then click the Go button. In the Add-Ins dialog box, click the Solver Add-In check box and then click the OK button. Follow any remaining prompts to install Solver. a. enable it. Then, click OK. DE PROJECT STEPS 1. Dewayne Lipinski works for Cairo Consulting in Albuquerque, New Mexico. As an intern, he is developing a workbook that includes the financial details of the consulting services that the company offers. Dewayne has been asked to analyze the data to find the most profitable mix of offerings using the most cost-effective service providers. Switch to the Management worksheet. Create a one-variable data table to calculate the sales, expenses, and profit based on the hours of management consulting contracted, as follows: In cell D5, enter a formula without using a function that references cell B4, which is the expected hours of management consulting contracted. b. In cell E5, enter a formula without using a function that references cell B19, which is the expected total sales for management consulting. In cell F5, enter a formula without using a function that references cell B20, which is the expected total expenses for this product. d. In cell G5, enter a formula without using a function that references cell B21, which is the expected gross profit for this product. Select the range D5:G10 and then complete the one-variable data table, using cell B4 as the Column input cell for your data table. C. e. 2. a. C. 3. 4. Create a two-variable data table to calculate the gross profit based on the hours of management consulting contracted and the hourly rate charged: For the range D14:K19, create a two-variable data table using the hourly rate charged (cell B5) as the Row input cell. b. Use the hours of management consulting contracted (cell B4) as the Column input cell. Apply a custom format to cell D14 to display the text Hours/Price in place of the cell value. Switch to the Change worksheet. Create a Scatter with Straight Lines chart based on the range D4:F14 in the data table Organizational Change - Break-Even Analysis. Modify the new chart as follows: Resize and reposition the chart so that it covers the range D15:H32. Remove the chart title from the chart. Add Sales and Expenses as the vertical axis title and Hours Contracted as the horizontal axis title. Change the Bounds Axis Options as follows: Change the Minimum Bounds of the vertical axis to 1,000,000 and leave the Maximum Bounds at 2,000,000. b. Change the Number format of the vertical axis to Currency with o Decimal places and $ as the Symbol. a. b. C. 5. a. XIII.1. III.2.1.3.4.1.5. III:6:47 a. C. Change the Minimum Bounds of the horizontal axis to 3,000 and the Maximum Bounds to 5,000. 6. Create two scenarios to compare the costs for standard consultants and consultants with change certification as follows: In the Scenario Manager, add two scenarios using the data shown in bold in Table 1 below. b. The changing cells for both scenarios are the nonadjacent cells B11 and B14. Close the Scenario Manager without showing any of the scenarios. Il Table 1: Organizational Change Scenario Values c. Values Scenario Name Variable_Cost_per_Hour_Change (B11) Total_Fixed_Cost_Change (B14) Scenario 1 Standard 380 Scenario 2 Certified 420 380,000 335,000 7. Switch to the Process worksheet. Create a Scatter with Straight Lines chart based on range D6:114 in the data table Process Consulting - Net Income Analysis. XIII.1. III.2.1.3.4.1.5. III:6:47 8. Modify the new chart as follows: a. Resize and reposition the chart so that it covers the range D15:132. b. Remove the chart title from the chart. c. Reposition the chart legend to the right of the chart. d. Add Net Income as the vertical axis title and Hours Contracted as the horizontal axis title. a. e. Change the colors of the chart to Monochromatic Palette 1 (1st row in the Monochromatic palette). 9. Change the Bounds Axis Options for the new chart as follows: Change the Minimum Bounds of the vertical axis to -100,000 and the Maximum Bounds to 650,000. b. Set the horizontal axis to cross at the axis value -100,000. Change the Number format of the vertical axis to Currency with O Decimal places and $ as the Symbol. d. Change the Minimum Bounds of the horizontal axis to 3,500 and the Maximum Bounds to 7,500. 10. Edit the chart series names as follows: a. For Series 1, use cell E5 as the series name. b. For Series 2, use cell F5 as the series name. c. For Series 3, use cell G5 as the series name. e. a. d. For Series 4, use cell 45 as the series name. For Series 5, use cell 15 as the series name. 11. Cairo Consulting wants to determine whether reselling process consulting services provided by third parties would reduce the costs of this type of consulting. Switch to the Process Providers worksheet, and then run Solver to solve this problem as follows: Set the objective as minimizing the value in cell E10 (Total Costs). b. Use the range B4:04 as the changing variable cells. Adjust the hours provided by each company using the following constraints: E4=5500, the total hours of process consulting signed d. E10 is less than or equal to 1350000, the maximum third-party fees B4:04 is less than or equal to 5000, the maximum hours provided by a single third-party provider f. B4:04 should be an Integer g. Run Solver, keep the solution, and then return to the Solver Parameters dialog box. Save the model to the range A14:A21, and then close the Solver Parameters dialog box. C. e. a. c. 12. Switch to the All Types worksheet. Use the Scenario Manager to create a Scenario Summary report that summarizes the effect of the Status Quo, Third Party, and Raise Rates scenarios. Use the range B17:017 as the result cells. 13. Switch back to the All Types worksheet. Use the Scenario Manager as follows to compare the profit per hour in each scenario: Create a Scenario PivotTable report for result cells B17:017. b. Remove the Filter field from the Pivottable. Change the Number format of the Profit_Per_Hour_Contracted_Mana, Profit_per_Hour_Contracted_Chan, and Profit_Per_Hour_Contracted_Proc fields (located in the Values box of the PivotTable Field List) to Currency with 2 Decimal places and $ as the Symbol. d. Use Management as the row label value in cell B3, Change as the value in cell c3, and Process as the value in cell D3. In cell A1, use Profit Per Hour Contracted as the report title. f. Format the report title using the Title cell style. g. Resize columns A-D to 15.00. 14. Add a PivotChart to the Scenario PivotTable worksheet as follows: Create a Clustered Column PivotChart based on the Pivottable. b. Resize and reposition the chart so that it covers the range A8:D20. e. a. Hide the field buttons in the chart. [Mac Hint: The Field Buttons option is not available on Excel 2019 for the Mac, so Mac users can ignore this instruction.] Your workbook should look like the Final Figures on the following pages. Save your changes, close the workbook, and then exit Excel. Follow the directions on the SAM website to submit your completed project. A B D E F G H J K Management - Profit Analysis Total Sales Total Expenses Gross Profit Hours Contracted 7,500 6,500 7,000 7,500 8,000 8,500 1 Cairo Consulting - Management 2 3 Sales 4 Hours Sold 7,500 5 Price Per Hour $ 310.00 6 Total Sales $ 2,325,000.00 7 8 Expenses 9 Variable Expenses 10 Hours Contracted 7,500 11 Variable Cost Per Hour $ 190.00 12 Total Variable Costs $ 1,425,000.00 73 Fixed Expenses 74 Total Fixed Cost $ 770,000.00 15 Expenses - Total $ 2,195,000.00 16 Total Expense Per Hour Contracted $ 292.67 17 18 Profit 19 Total Sales $ 2,325,000.00 20 Total Expenses $ 2,195,000.00 Documentation Management Change Management - Gross Profit Analysis 290.00 $ 300.00 $ 310.00 $ $ 280.00 $ 320.00 $ 330.00 $ 340. 130,000 $ 6,500 7,000 7,500 8,000 8,500 Process Process Providers All Types + D F G H - J K $ 130,000.00 $ $ 310.00 292.67 7,500 130,000.00 $ 21 Gross Profit 22 23 Break-Even Analysis 24 Price Per Hour 25 Cost Per Hour 26 Hours Contracted 27 Gross Profit 28 29 30 31 32 33 34 35 36 37 38 39 40 Documentation Management Change Process Process Providers All Types + H J K A B C D E F G 1 Cairo Consulting - Organizational Change 2 3 Sales Organizational Change - Break-Even Analysis 4 Hours Sold 3,750 Hours Contracted Total Sales Total Expenses Gross Profit 5 Price Per Hour $ 380.00 3,750 1,425,000 1,373,750 51,250 6 Total Sales $ 1,425,000.00 3,000 1,140,000 1,175,000 (35,000) 7 3,250 1,235,000 1,241,250 (6,250) 8 Expenses 3,500 1,330,000 1,307,500 22,500 9 Variable Expenses 3,750 1,425,000 1,373,750 51,250 10 Hours Contracted 3,750 4,000 1,520,000 1,440,000 80,000 11 Variable Cost Per Hour $ 265.00 4,250 1,615,000 1,506,250 108,750 12 Total Variable Costs $ 993,750.00 4,500 1,710,000 1,572,500 137,500 73 Fixed Expenses 4,750 1,805,000 1,638,750 166,250 74 Total Fixed Cost $ 380,000.00 5,000 1,900,000 1,705,000 195,000 15 Expenses - Total $ 1,373,750.00 16 Total Expense Per Hour Contracted $ 366.33 17 18 Profit 19 Total Sales $ 1,425,000.00 20 Total Expenses $ 1,373,750.00 Documentation Management Change Process Process Providers + All Types D E F G H J K B 51,250.00 $ $ $ 380.00 366.33 3,750 51,250.00 $ 21 Gross Profit 22 23 Break-Even Analysis 24 Price Per Hour 25 Cost Per Hour 26 Hours Contracted 27 Gross Profit 28 29 30 31 32 33 34 35 36 37 38 39 40 Documentation Management Change Process Process Providers All Types + G H Hours Contracted $ 3,500 4,000 4,500 5,000 Process Consulting - Net Income Analysis Average Price Per Hour 270.00 $ 280.00 $ 290.00 $ (92,500.00) (57,500.00) (22,500.00) (50,000.00) (10,000.00) 30,000.00 (7,500.00) 37,500.00 82,500.00 35,000.00 85,000.00 135,000.00 77,500.00 132,500.00 187,500.00 120,000.00 180,000.00 240,000.00 162,500.00 227,500.00 292,500.00 205,000.00 275,000.00 345,000.00 247,500.00 322,500.00 397,500.00 1 Cairo Consulting - Process 2 3 Sales 4 Hours Sold 5,500 5 Price Per Hour $ 290.00 6 Total Sales $ 1,595,000.00 7 8 Expenses 9 Variable Expenses 10 Hours Contracted 5,500 11 Variable Cost Per Hour $ 185.00 12 Total Variable Costs $ 1,017,500.00 73 Fixed Expenses 14 Total Fixed Cost $ 390,000.00 15 Expenses - Total $ 1,407,500.00 16 Total Expense Per Hour Contracted $ 255.91 17 18 Profit 19 Total Sales $ 1,595,000.00 20 Total Expenses $ 1,407,500.00 Documentation Management Change 300.00 $ 12,500.00 70,000.00 127,500.00 185,000.00 242,500.00 300,000.00 357,500.00 415,000.00 472,500.00 310.00 47,500.00 110,000.00 172,500.00 235,000.00 297,500.00 360,000.00 422,500.00 485,000.00 547,500.00 5,500 6,000 6,500 7,000 7,500 Process Process Providers All Types + D E F G H - J $ 187,500.00 $ $ 290.00 255.91 5,500 187,500.00 $ 21 Gross Profit 22 23 Break-even Analysis 24 Price Per Hour 25 Cost Per Hour 26 Hours Contracted 27 Gross Profit 28 29 30 31 32 33 34 35 36 37 38 39 40 Documentation Management Change Process Process Providers All Types + A B D E F G H J L M N N o P Total 5,500 1 Cairo Consulting - Process Consulting Providers 2 3 Process Pros ABQ Consulting Tema Han 4 Hours Provided 500 0 5,000 5 5 6 Fixed Costs $ 178,000.00 $ 280,000.00 $ 26,700.00 7 Fixed Cost Per Hour 356.00 5.34 8 Variable Costs 104,500.01 1,025,000.00 9 Variable Cost Per Hour 209.00 220.00 205.00 10 Total Costs $ 282,500 $ $ 1,051,700 $ 11 12 13 Minimum Total Cost Model 14 - 1,334,200 15 16 17 18 19 20 Documentation Management Change Process Process Providers All Types + A B D E F G H J K L M N o o 1 1 Cairo Consulting - Product Mix 2 Organizational Management Process 3 Change 4 Revenues 5 Hours Sold 7,500 3,750 5,500 6 Price Per Hour $ 310.00 $ 380.00 $ 290.00 7 Total Sales $ 2,325,000.00 $ 1,425,000.00 $ 1,595,000.00 8 9 Cost of Goods Sold 10 Hour Contracted 7,500 3,750 5,500 11 Fixed Costs $ 770,000.00 $ 380,000.00 $ 390,000.00 12 Variable Cost Per Hour $ 190.00 $ 265.00 $ 185.00 13 Variable Costs $ 1,425,000.00 $ 993,750.00 $ 1,017,500.00 14 Total Costs $ 2,195,000.00 $ 1,373,750.00 $ 1,407,500.00 15 76 Total Profit $ 130,000 $ 51,250 $ 187,500 17 Profit Per Hour Contracted $17.33 $13.67 $34.09 18 19 Documentation Management Change Process Process Providers All Types (+)
Step by Step Solution
There are 3 Steps involved in it

Get step-by-step solutions from verified subject matter experts