

Question: Calculate as many as possible ratios from the given data. Please solve soon as possible only 6 hours left. Thank you so much in advance.
Calculate as many as possible ratios from the given data. Please solve soon as possible only 6 hours left. Thank you so much in advance.
If you not understand please let me know I provide you class video link
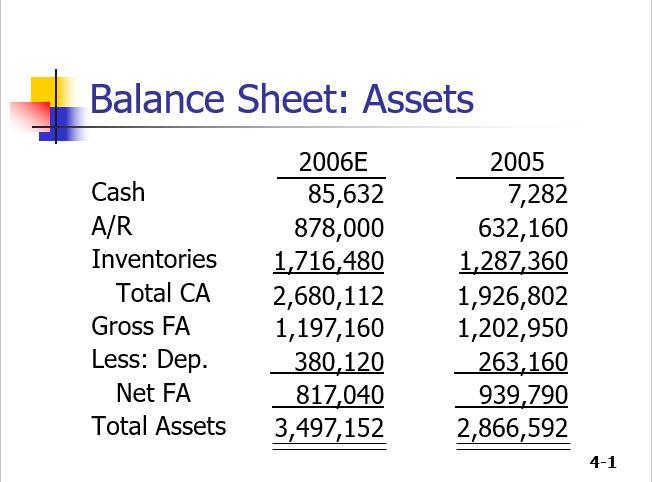
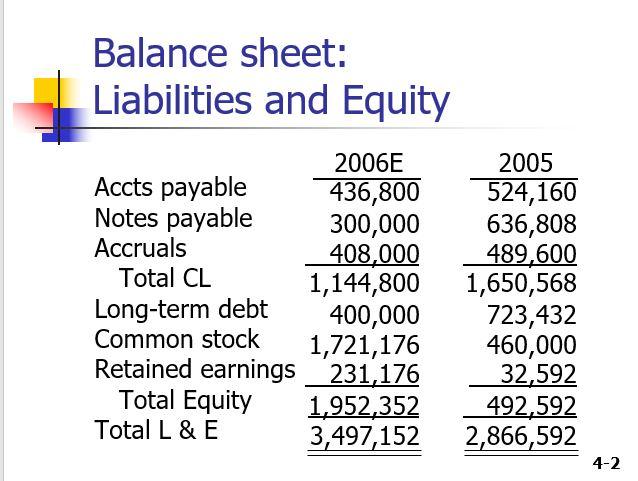
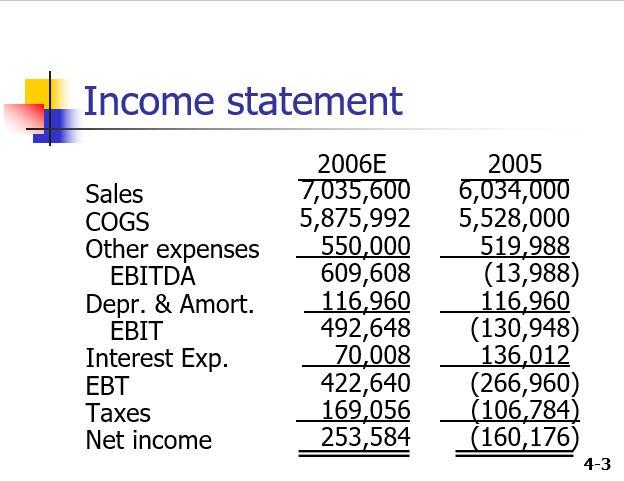
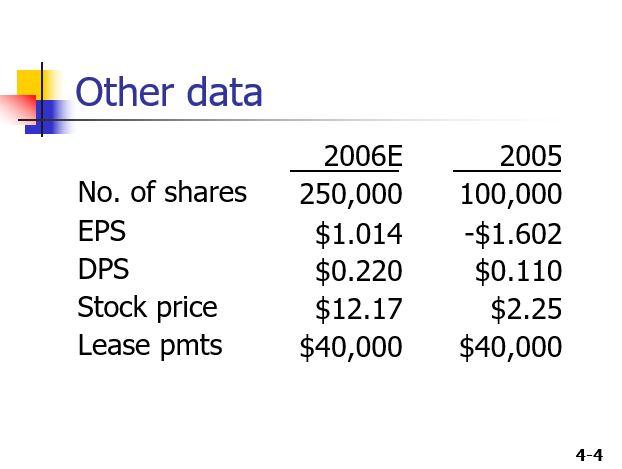
Balance Sheet: Assets Cash A/R Inventories Total CA Gross FA Less: Dep. Net FA Total Assets 2006E 85,632 878,000 1,716,480 2,680,112 1,197,160 380,120 817,040 3,497,152 2005 7,282 632,160 1,287,360 1,926,802 1,202,950 263,160 939,790 2,866,592 4-1 Balance sheet: Liabilities and Equity 2006E Accts payable 436,800 Notes payable 300,000 Accruals 408,000 Total CL 1,144,800 Long-term debt 400,000 Common stock 1,721,176 Retained earnings 231,176 Total Equity 1,952,352 Total L & E 3,497,152 2005 524,160 636,808 489,600 1,650,568 723,432 460,000 32,592 492,592 2,866,592 4-2 Income statement Sales COGS Other expenses EBITDA Depr. & Amort. EBIT Interest Exp. EBT Taxes Net income 2006E 7,035,600 5,875,992 550,000 609,608 116,960 492,648 70,008 422,640 169,056 253,584 2005 6,034,000 5,528,000 519,988 (13,988) 116,960 (130,948) 136,012 (266,960) (106,784) (160,176) 4-3 Other data 2006E 2005 No. of shares EPS DPS Stock price Lease pmts 250,000 $1.014 $0.220 $12.17 $40,000 100,000 -$1.602 $0.110 $2.25 $40,000 4-4
Step by Step Solution
There are 3 Steps involved in it

Get step-by-step solutions from verified subject matter experts