

Question: Calculate as many as possible ratios from the given data. Please solve soon as possible. Thank you so much in advance If you not understand
Calculate as many as possible ratios from the given data. Please solve soon as possible. Thank you so much in advance
If you not understand let me know i provide you class video link.
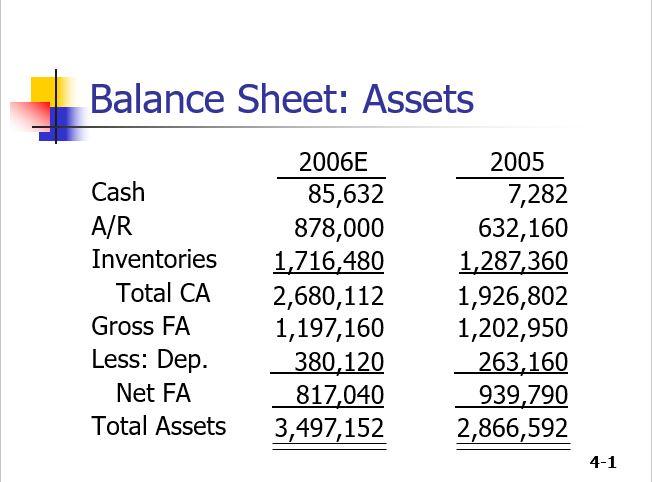
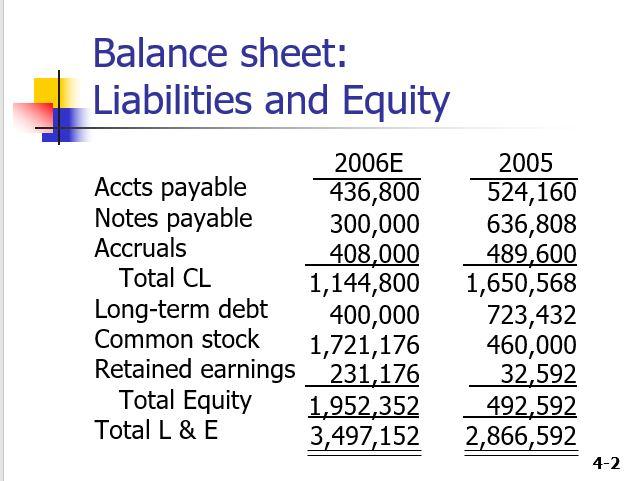
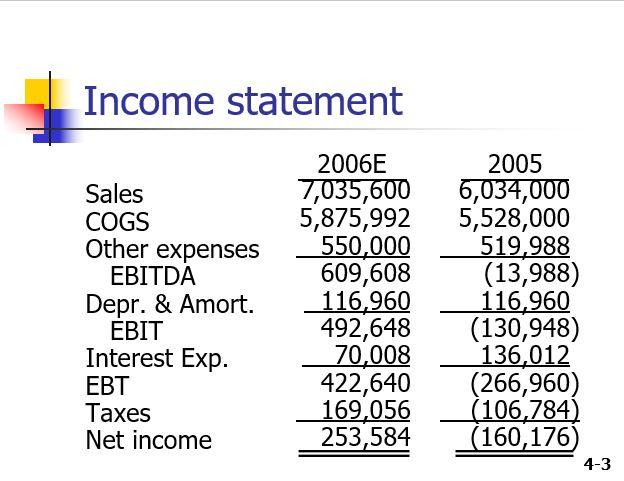
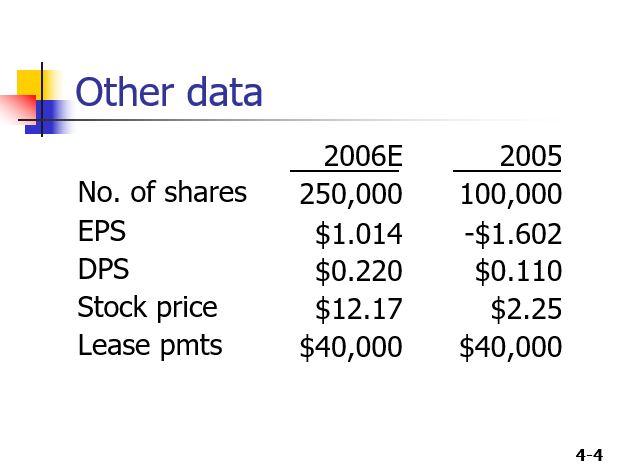
Balance Sheet: Assets Cash A/R Inventories Total CA Gross FA Less: Dep. Net FA Total Assets 2006E 85,632 878,000 1,716,480 2,680,112 1,197,160 380,120 817,040 3,497,152 2005 7,282 632,160 1,287,360 1,926,802 1,202,950 263,160 939,790 2,866,592 4-1 Balance sheet: Liabilities and Equity 2006E Accts payable 436,800 Notes payable 300,000 Accruals 408,000 Total CL 1,144,800 Long-term debt 400,000 Common stock 1,721,176 Retained earnings 231,176 Total Equity 1,952,352 Total L & E 3,497,152 2005 524,160 636,808 489,600 1,650,568 723,432 460,000 32,592 492,592 2,866,592 4-2 Income statement Sales COGS Other expenses EBITDA Depr. & Amort. EBIT Interest Exp. EBT Taxes Net income 2006E 7,035,600 5,875,992 550,000 609,608 116,960 492,648 70,008 422,640 169,056 253,584 2005 6,034,000 5,528,000 519,988 (13,988) 116,960 (130,948) 136,012 (266,960) (106,784) (160,176) 4-3 Other data 2006E 2005 No. of shares EPS DPS Stock price Lease pmts 250,000 $1.014 $0.220 $12.17 $40,000 100,000 -$1.602 $0.110 $2.25 $40,000 4-4
Step by Step Solution
There are 3 Steps involved in it

Get step-by-step solutions from verified subject matter experts