

Question: . Calculate average for each sample group . Generate a Line graph using Excel Determine IC20, IC50, and IC80 Drug B Solvent 0.01 UM 0.1

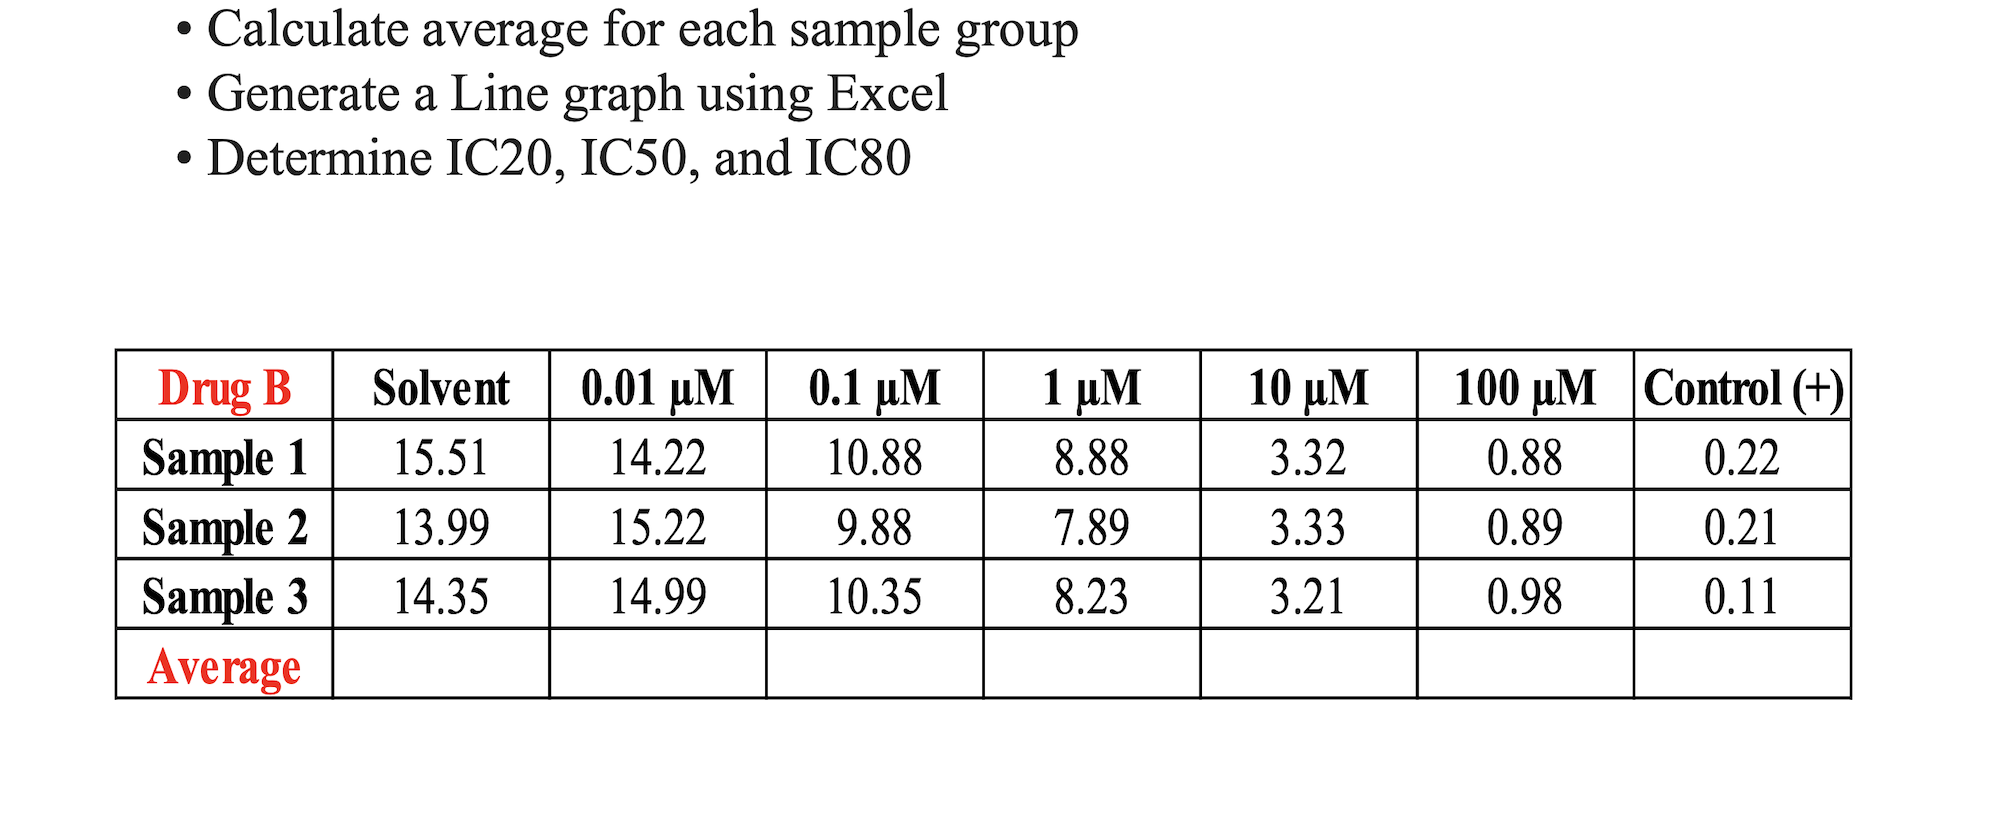
. Calculate average for each sample group . Generate a Line graph using Excel Determine IC20, IC50, and IC80 Drug B Solvent 0.01 UM 0.1 UM 1 UM 10 UM 100 UM Control (+) Sample 1 15.51 14.22 10.88 8.88 3.32 0.88 0.22 Sample 2 13.99 15.22 9.88 7.89 3.33 0.89 0.2 Sample 3 14.35 14.99 10.35 8.23 3.21 0.98 0.11 Average
Step by Step Solution
There are 3 Steps involved in it
1 Expert Approved Answer
Step: 1 Unlock

Question Has Been Solved by an Expert!
Get step-by-step solutions from verified subject matter experts
Step: 2 Unlock
Step: 3 Unlock